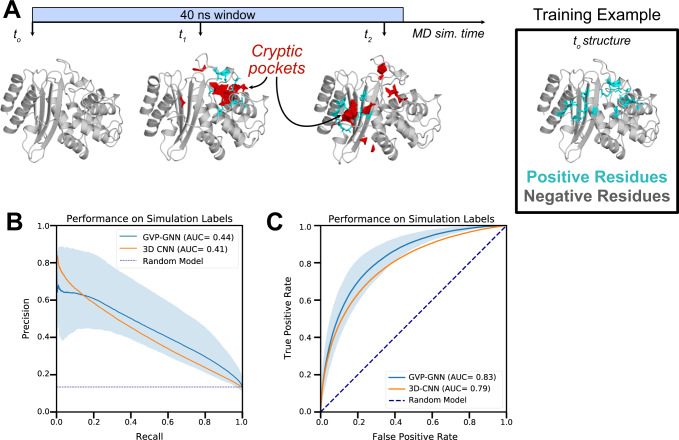
Fig. 3. Graph neural networks accurately forecast the sites of pocket formation in new simulations.
A We used MD simulations to generate training labels by tracking where cryptic pockets (shown in red) form. Residues were labeled as positive examples if a cryptic pocket formed nearby that residue at any point in simulation (shown in cyan). As an illustration, we show the TEM β-lactamase protein, which forms cryptic pockets at two separate sites (i.e., the horn pocket and the omega loop pocket) in a single MD simulation. Each opening event marks the nearby residues as positive examples, so the training labels for this window reflect both opening events with residues around both pockets marked as positive examples. The starting structure can then be fed to a graph neural network that predicts where cryptic pockets will form. B Precision-recall curves across 5 different folds demonstrate that a graph neural network trained with simulation starting structures and labels derived from simulation intermediates predicts which residues will form cryptic pockets in simulation (mean PR-AUC of 0.44). The shaded region represents variation in performance across folds with the top of the shaded region tracing the curve with the highest PR-AUC and the bottom of the shaded region tracing the curve with the lowest PR-AUC. GVP-GNN refers to the Geometric Vector Perceptron-based Graph Neural Network; 3D-CNN refers to the 3D Convolutional Neural Network. C Receiver operating curves across 5 different folds demonstrate robust performance (mean ROC-AUC of 0.83). Shading represents variation across folds (worst to best performance across 5 folds). Source data are provided as a Source Data file.

