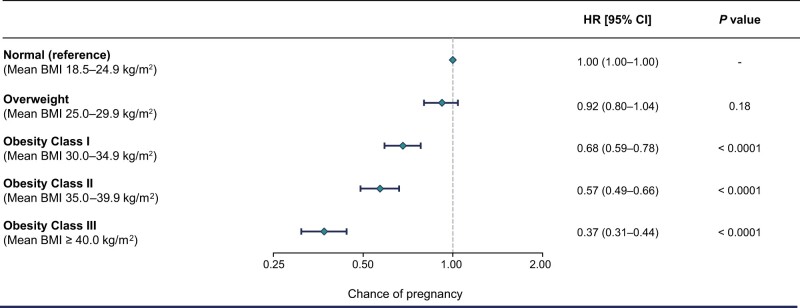
Figure 2.
Chance of pregnancy by baseline BMI category. Analysis performed using data from the Study 1 cohort (N = 9955), which was sampled to evaluate the association between BMI category and chance of pregnancy relative to normal weight. Diamonds indicate hazard ratios for pregnancy by baseline BMI categories, calculated using a Cox proportional hazard model. The horizontal lines indicate the 95% CIs. The model was adjusted for glycaemic status (diabetes or glycated haemoglobin ≥6.0%; HR 0.74, 95% CI 0.54–1.02; P = 0.066) and age as a quadratic term (HR 0.990, 95% CI 0.988–0.991; P < 0.0001). HR, hazard ratio.

