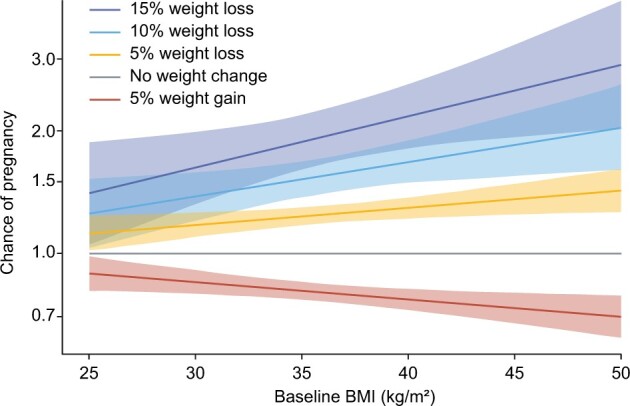
Figure 4.

Chance of pregnancy for selected body weight changes by baseline BMI. Analysis performed using data from the Study 2 cohort (N = 7593), which was sampled to evaluate the association between weight loss and chance of pregnancy. The plot illustrates the chance of pregnancy, as estimated by the Cox proportional hazard model, across the full baseline BMI range for selected body weight changes (5% weight gain and 5%, 10% and 15% weight loss). The reference is stable weight (no weight change) as shown by the grey line. The estimated chance of pregnancy was calculated with the 95% CIs for each individual BMI value and visualized as continuous lines across the full range.
