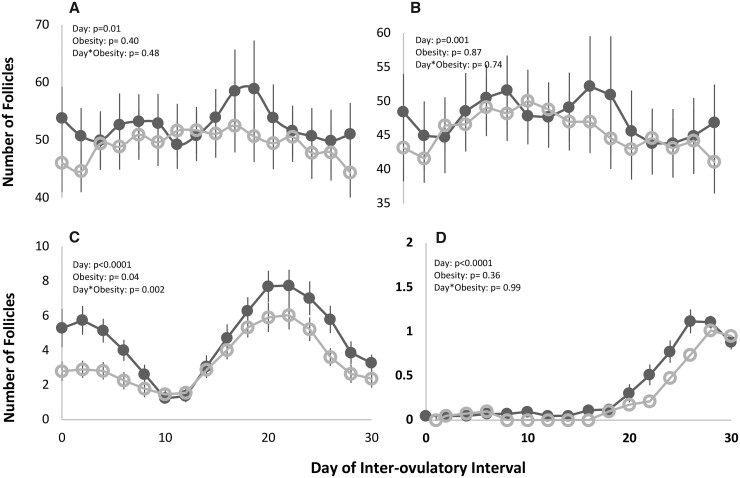
Figure 2.
Longitudinal profiles of total (A), 2–5 mm (B), 6–9 mm (C), and ≥10 mm (D) antral follicle counts across an inter-ovulatory interval (IOI) in non-obese (black ⬤) and obese women (gray ○). Day-to-day changes in total follicle counts per follicle size category were monitored using the Non-Identity Method. Mixed models showed a day effect for total, 2–5, 6–9, and ≥10 mm follicles, and an obesity effect for 6–9 mm follicles. Day-by-obesity effects were noted for 6–9 mm follicles.

