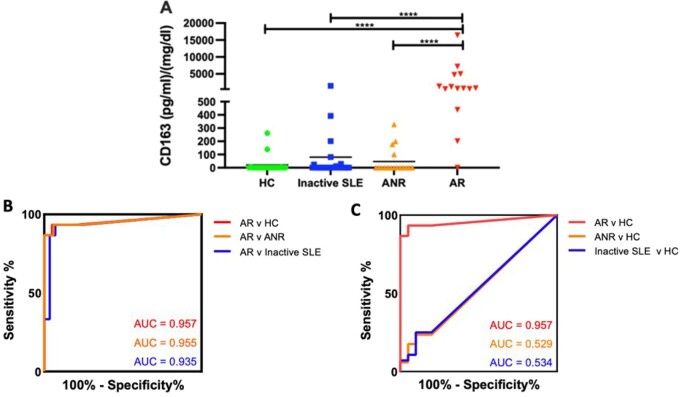
Fig. 1.
Discriminatory power of urine CD163 for active renal lupus
(A) Dot plot displaying creatinine normalized urine CD163 levels in SLE patients and healthy control groups. The y-axis shows the concentration of CD163 (pg/mg) and the x-axis shows the four groups under investigation (20 healthy controls, 28 inactive SLE, 17 active nonrenal and 15 active). Means are indicated. Only comparisons attaining statistical significance are indicated with P-values. *P < 0.05, **P < 0.01, ***P < 0.001, ****P < 0.0001. (B) Values in the plot indicate the AUC. Urine CD163 performed excellently in discriminating active renal from healthy controls. The 95% CIs for active renal vs healthy controls, active renal vs active nonrenal and active renal vs inactive SLE AUCs were 0.88 to 1.00, 0.87 to 1.00 and 0.84 to 1.00, respectively. (C) Values in the plot indicate the AUC of healthy control patients versus all other cohorts. The 95% CIs for active renal vs healthy control, active nonrenal vs healthy control and inactive SLE vs healthy control AUCs were 0.88 to 1.00, 0.34 to 0.72 and 0.37 to 0.70, respectively.

