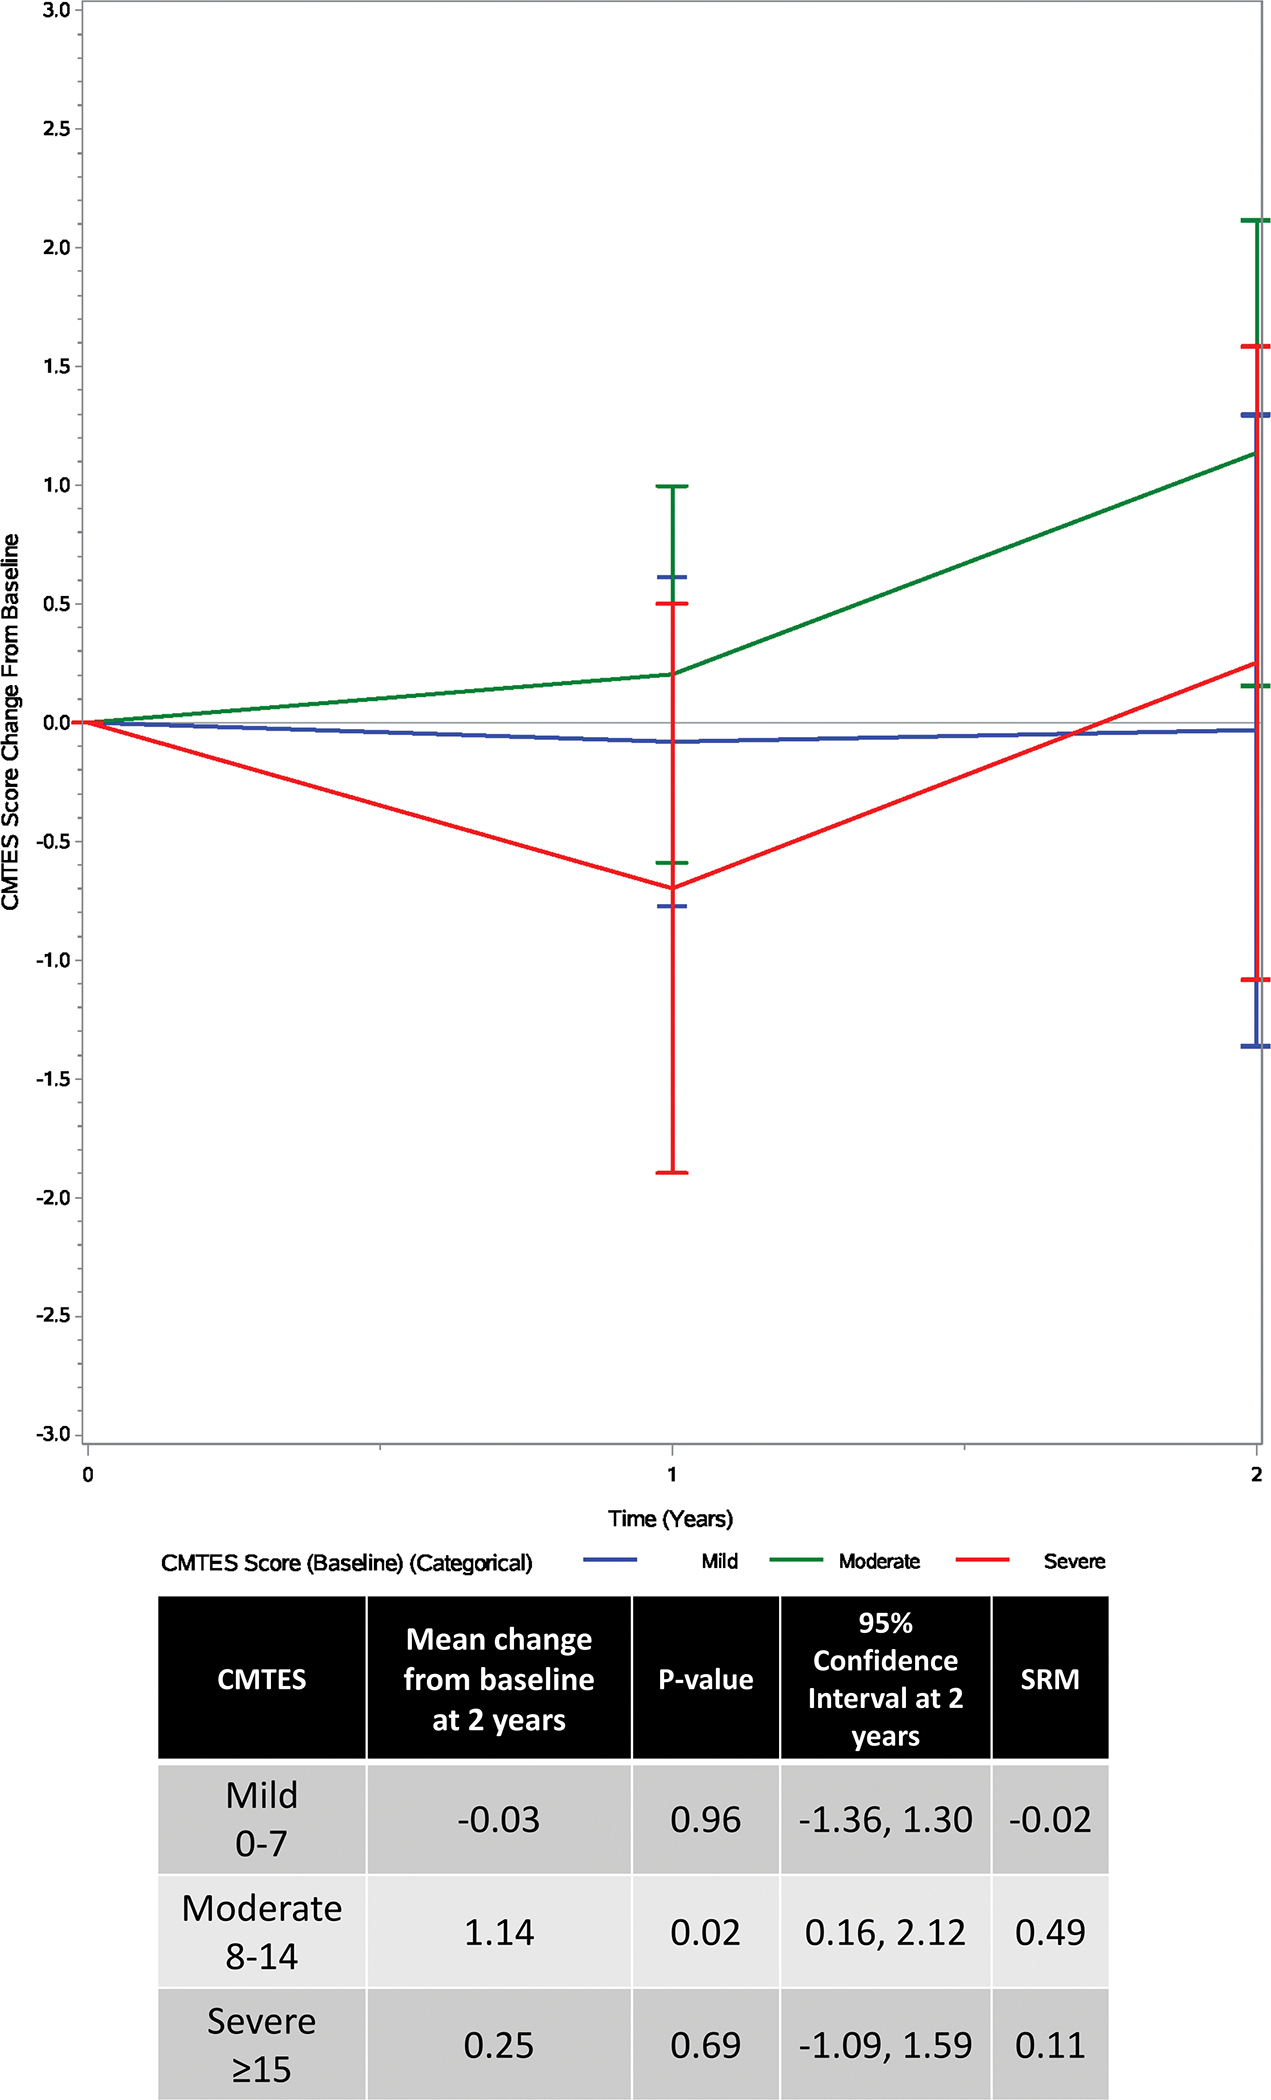
FIGURE 4 -. Influence of baseline disease severity Legend:

Categorical model showing change in CMTES based on disease severity at baseline over a 2-year period. Red=mild (CMTES 0–7), green=moderate (CMTES 8–14), blue=severe (CMTES ≥15). Bars are the 95% confidence intervals.
