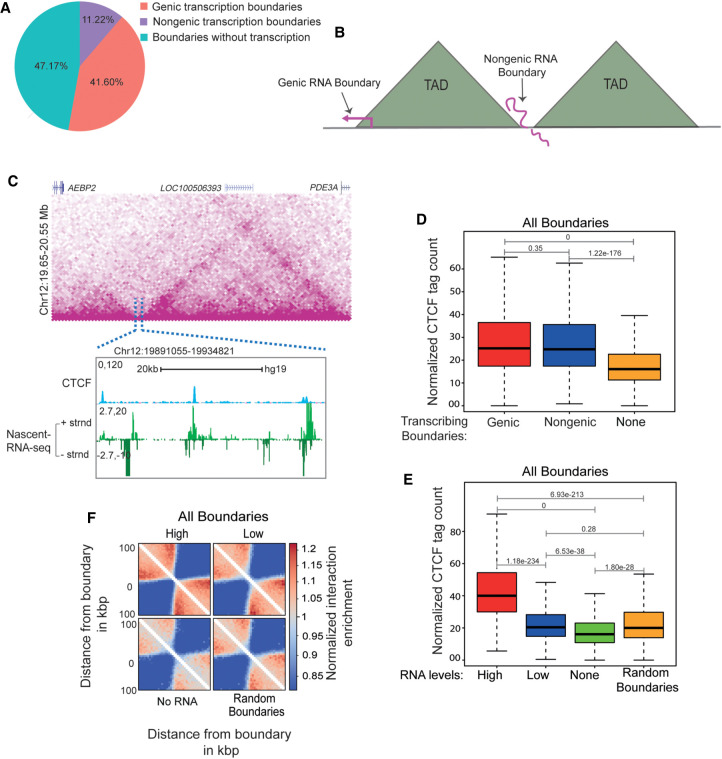
Figure 1.
Transcribed TAD boundaries insulate better than nontranscribed boundaries. (A) Pie chart displaying the percentage of boundaries that show genic transcription, nongenic de novo transcription, and no transcription. (B) Schematic depicting genic and nongenic transcribed boundaries. (C) Browser shot displaying a TAD structure from Hi-C data. The zoomed-in box shows a de novo nongenic transcribed boundary region that is overlaid with CTCF and mNET-seq signal. (D) Boxplots showing CTCF enrichment on genic, nongenic, and nontranscribed boundaries. (E) Boxplots showing CTCF enrichment on all boundaries showing varying levels of RNAs versus nontranscribed and random boundaries. (F) Pile up (aggregated normalized Hi-C interactions) plot centered at high transcribed, low transcribed, nontranscribed, and random boundaries at a 5-kb resolution. The 100-kb distances are taken from the boundary region. The P-values in boxplots were calculated using the Wilcoxon rank-sum test. The boxplots depict the minimum (Q1 – 1.5 × IQR), first quartile, median, third quartile, and maximum (Q3 + 1.5 × IQR) without outliers.

