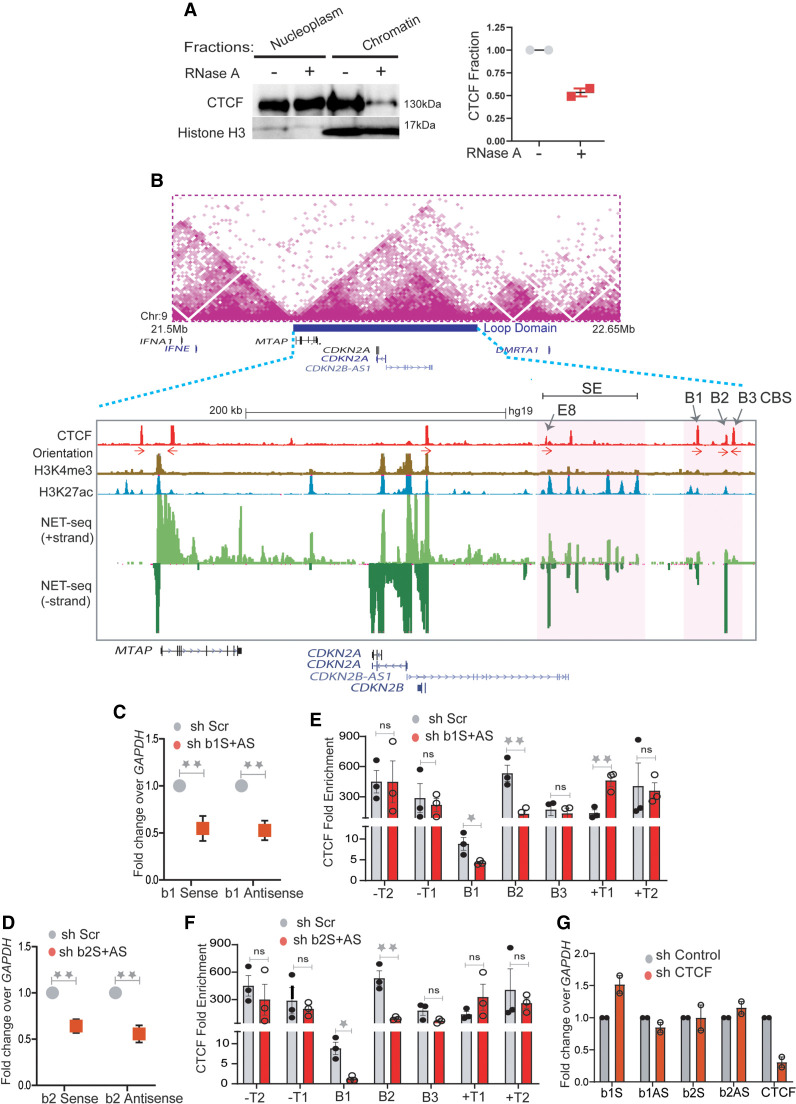
Figure 2.
RNA increases CTCF occupancy at TAD boundaries. (A) Immunoblotting with CTCF and histone H3 on soluble nucleoplasm and chromatin-bound fractions of the nucleus treated with or without RNase A (left). The right panel shows the quantified loss of CTCF from chromatin fractions from two replicates. (B) TAD structure at INK4a/ARF locus on 9p21 region (Rao et al. 2014). The loop domain (blue bar) is overlaid by the position of CTCF peaks, CTCF motif orientation, H3K4me3, H3K27ac (enhancers), mNET-seq tracks, and gene annotations. The highlighted region shows the B1, B2, and B3 CTCF sites on the 3′ boundary and super-enhancer with the position of enhancer E8 marked by an arrow. (C) qRT-PCRs showing the levels of sense and antisense noncoding RNA at B1 CTCF site upon B1 RNA knockdown. (D) qRT-PCRs showing the levels of sense and antisense RNA at the B2 CTCF site upon B2 RNA knockdown. (E) CTCF ChIP enrichment before and after shRNA-mediated knockdown of sense and antisense RNA at B1 CTCF sites. The bars show CTCF fold enrichment on three CTCF sites (B1, B2, and B3) at the 3′ boundary, on −T1 (5′ boundary) of the INK4a/ARF TAD, on -T2 on the adjacent TAD boundary upstream, +T1 (on the adjacent TAD boundary downstream), and +T2, the boundary of the following TAD downstream. (F) CTCF ChIP enrichment before and after shRNA-mediated knockdown of sense and antisense RNA at B2 CTCF sites. The bars show CTCF on three CTCF sites (B1, B2, and B3) at the 3′ boundary, on −T1 (5′ boundary) of the INK4a/ARF TAD, on −T2 of the adjacent TAD boundary upstream, on +T1 of the adjacent TAD boundary downstream, and on +T2 of the boundary of the following TAD downstream. (G) qRT-PCRs of sense and antisense RNAs from B1 and B2 CTCF sites upon CTCF knockdown. The drops in CTCF levels are shown in the last two bars. Error bars denote SEM from three biological replicates. P-values were calculated by the Student's two-tailed unpaired t-test in C–F. (**) P < 0.01, (*) P < 0.05, (ns) P > 0.05.

