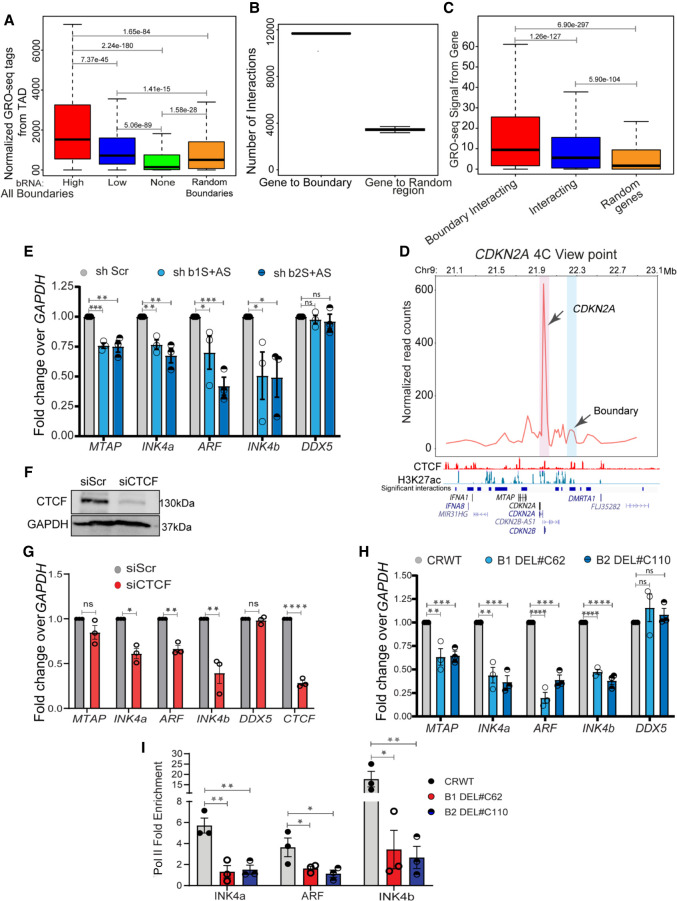
Figure 3.
Boundary RNAs enhance TAD transcription. (A) Boxplots showing GRO-seq tags from the entire TAD with high, low, nontranscribed, and random boundaries. (B) Graph showing the number of interactions between genes and boundaries, and 100 randomizations of interactions between boundaries and random regions. (C) Boxplots showing the GRO-seq tag counts from genes when they interact with boundaries or any region versus random interactions. (D) 4C plot at the CDKN2A promoter viewpoint, where the interaction with the boundary is highlighted in blue. Below the plot, significant interactions, H3K27ac, CTCF, and gene annotations for HeLa cells are marked. (E) qRT-PCR plot shows the change in gene expression upon shRNA-mediated knockdowns of boundary RNAs arising from B1 and B2 CTCF sites at the INK4a/ARF TAD boundary. (F) Immunoblot showing the drop in CTCF protein levels upon its siRNA-mediated knockdown. (G) qRT-PCRs showing down-regulation of INK4a/ARF, DDX5, and CTCF upon CTCF knockdown. (H) qRT-PCR showing the changes in expression of different genes in the INK4a/ARF TAD and DDX5 upon Cas9-mediated independent deletion of B1 and B2 CTCF sites. (I) Pol II ChIP signal at INK4a, ARF, and INK4b promoters in WTs and in cells with B1 and B2 CTCF sites deletions. Error bars denote SEM from three biological replicates. P-values were calculated by the Student's two-tailed unpaired t-test in E and G–I. (****) P < 0.0001, (***) P < 0.001, (**) P < 0.01, (*) P < 0.05, (ns) P > 0.05. P-values in boxplots were calculated by the Wilcoxon two-sided rank-sum test. The boxplots depict the minimum (Q1 – 1.5 × IQR), first quartile, median, third quartile, and maximum (Q3 + 1.5 × IQR) without outliers.

