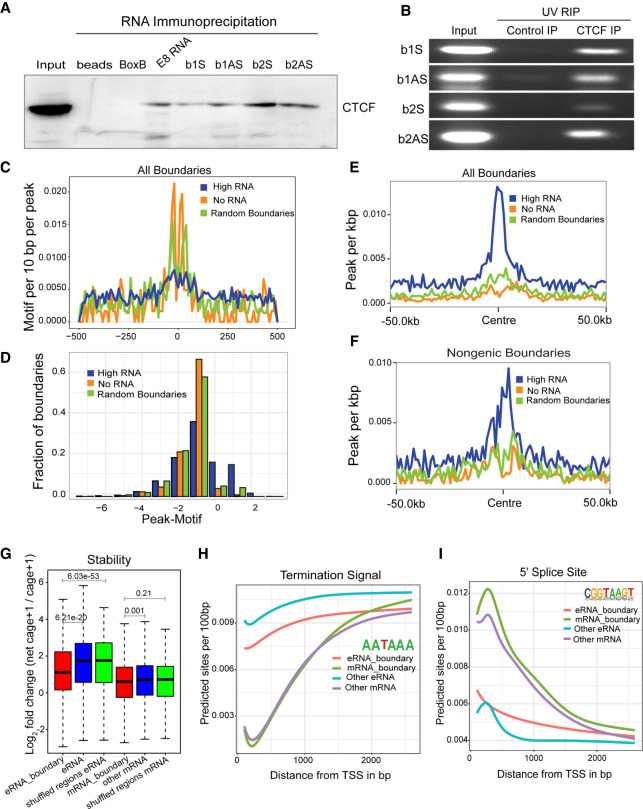
Figure 4.
Noncoding RNAs and CTCF interact at the INK4a/ARF TAD boundary. (A) Immunoblot for CTCF on RNA pulldowns performed on various RNAs (n = 2). (B) Agarose gel image showing the UV-RIP RT-PCRs for sense and antisense RNA arising from B1 and B2 CTCF sites (n = 2). (C) Line plots show the CTCF motif per 10 bp per peak on various classes of boundaries. (D) Fraction of boundaries with differential occupancy of CTCF peaks over the presence of the CTCF motif. (E) CTCF peaks per kilobase on all transcribed boundaries with high RNAs, no RNAs, and random boundaries (50-kb flanks on both sides). (F) CTCF peaks per kilobase on nongenic transcribed boundaries with high RNAs, no RNAs, and random boundaries. (G) Log2FC of net-cage + 1/cage + 1, indicating stability of RNA at TSSs identified from NET-CAGE at boundaries and TSSs not at boundaries. eRNA_boundary denotes the eRNAs from nongenic boundaries; mRNA_boundary denotes the mRNAs from genic boundaries. (H) Average predicted TSS from the TSS identified in different classes of RNA by NET-CAGE. (I) Average predicted 5′ SS sites from the TSS identified by NET-CAGE. The P-values in boxplots were calculated by the Wilcoxon rank-sum test. The boxplots depict the minimum (Q1 – 1.5 × IQR), first quartile, median, third quartile, and maximum (Q3 + 1.5 × IQR) without outliers.

