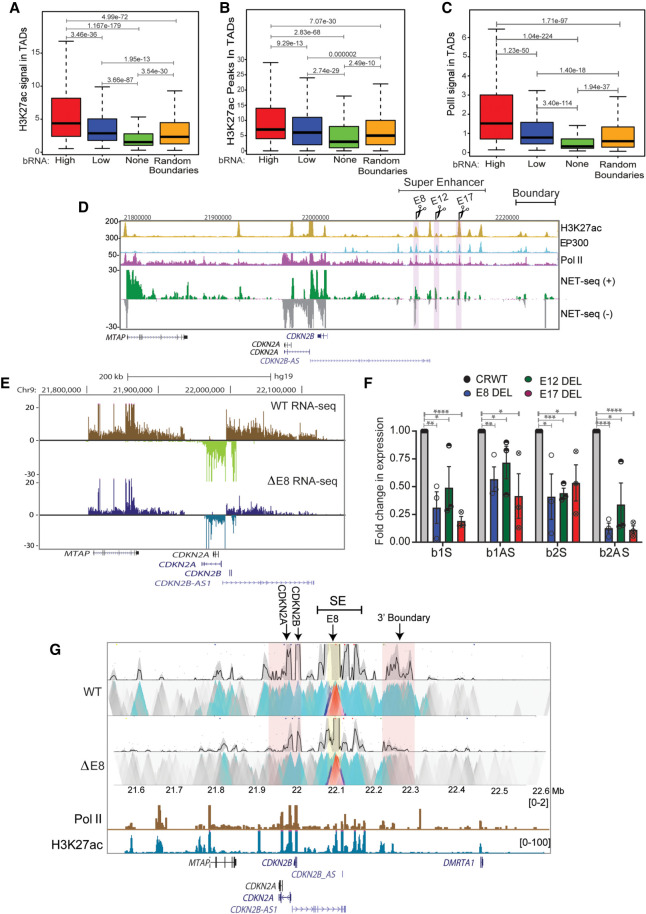
Figure 6.
Active enhancers within a TAD directly regulate boundary eRNA transcription. (A) Boxplots displaying enrichment of H3K27ac in TADs with high, low, nontranscribed, and random boundaries. (B) Boxplot showing number of H3K27ac peaks in TADs with various boundaries. (C) Levels of Pol II in TADs with different boundaries. (D) UCSC browser shot showing H3K27ac, EP300, Pol II ChIP-seq, and mNET-seq on the INK4a/ARF TAD. The tracks are overlaid by the gene annotations. The highlighted regions represent the enhancers (E8, E12, and E17) that were deleted. (E) Browser shot shows RNA-seq at INK4a/ARF TAD in WT and E8 enhancer delete lines. (F) qRT-PCR shows levels of sense and antisense boundary RNA arising from B1 and B2 CTCF sites upon E8, E12, and E17 enhancer deletions. (G) 4C-seq plot in WT and in E8 deletion lines on an enhancer beside E8 enhancer as viewpoint (yellow highlight), showing interactions with promoters and 3′ boundary region (pink highlight). Below are Pol II, H3K27ac ChIP-seq tracks, and gene annotations. Error bars denote SEM from three biological replicates. P-values were calculated by the Student's two-tailed unpaired t-test in F. (****) P < 0.0001, (***) P < 0.001, (**) P < 0.01, (*) P < 0.05. P-values in boxplots were calculated by the Wilcoxon rank-sum test. The boxplots depict the minimum (Q1 – 1.5 × IQR), first quartile, median, third quartile, and maximum (Q3 + 1.5 × IQR) without outliers.

