Figure 7.
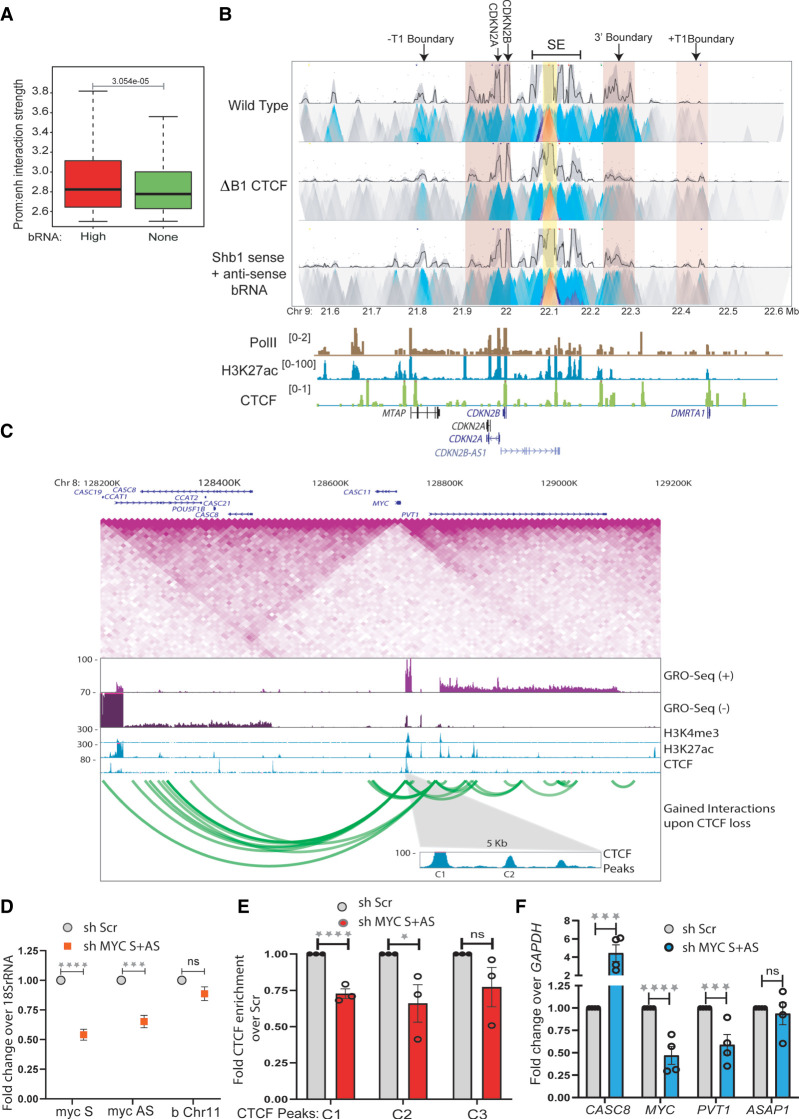
Boundary eRNAs strengthen TAD insulation. (A) Enhancer–promoter interaction strength within TADs with high and nontranscribed boundaries. (B) 4C-seq plot with the enhancer beside E8 enhancer as viewpoint (yellow highlight) in WT and upon B1 CTCF site deletion (ΔB1) and knockdown of B1 sense and antisense boundary RNAs. The anchored region shows interactions with promoters and the 3′ and +T1 boundaries (pink highlights). Below are Pol II, H3K27ac, and CTCF ChIP-seq tracks and gene annotations. (C) TAD structure at MYC locus on 8q24 region. The TAD diagram is overlaid by the position of CTCF, H3K4me3, H3K27ac, GRO-seq tracks, and gene annotations. The highlighted region shows the C1 and C2 CTCF sites on the 5′ boundary. The green looping tracks show the gain of interactions upon global CTCF knockdown. (D) qRT-PCRs showing the levels of sense and antisense RNA from MYC gene upon their shRNA-mediated knockdowns in a chromatin-associated RNA fraction. The level of RNA at Chr 11 boundary does not change. (E) CTCF ChIP enrichment before and after shRNA-mediated knockdown of sense and antisense MYC RNA at CTCF sites (C1, C2 at the 5′ TAD boundary, and C3 at upstream TAD boundary). (F) qRT-PCR showing the changes in expression of different genes in and around the MYC TAD upon shRNA-mediated knockdown of sense and antisense MYC RNA. Error bars denote SEM from three/four biological replicates. P-values were calculated by the Student's two-tailed unpaired t-test in D–F. (****) P < 0.0001, (***) P < 0.001, (**) P < 0.01, (*) P < 0.05, (ns) P > 0.05.

