Figure 2.
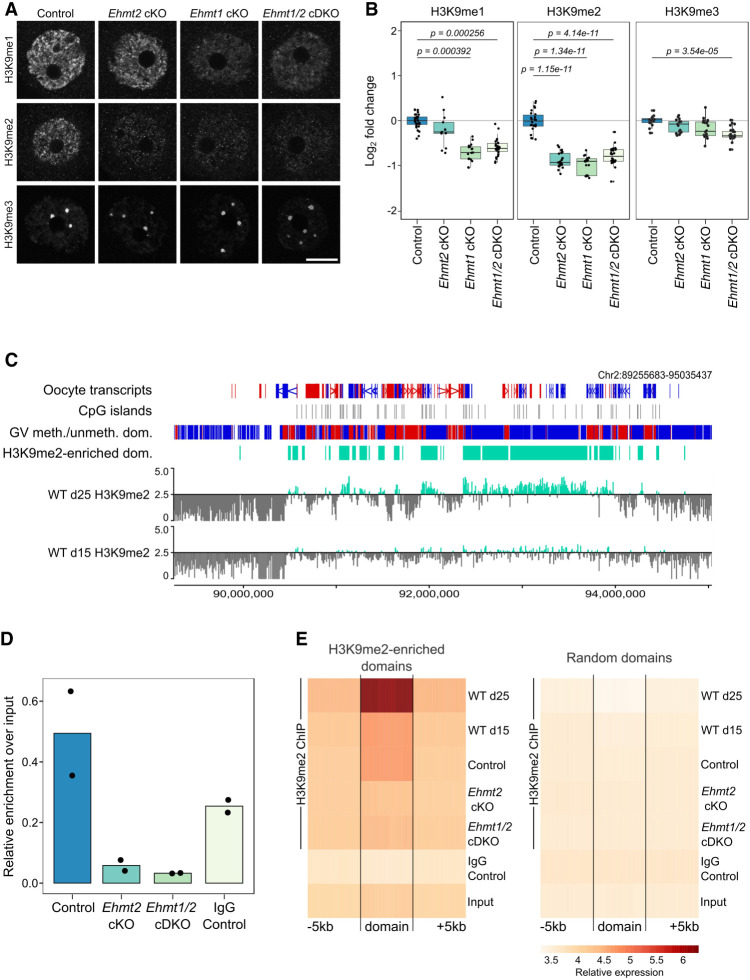
Analysis of H3K9 methylation in Ehmt2 cKO, Ehmt1 cKO, and Ehmt1/2 cDKO oocytes. (A) Representative IF images of NSN oocytes for H3K9me1, H3K9me2, and H3K9me3 in control and Ehmt2 cKO, Ehmt1 cKO, and Ehmt1/2 cDKO oocytes. Scale bar: 20 μm. (B) Boxplots of quantitation of IF images. Dots represent individual oocytes. Analysis is based on two to five mice per genotype and three to four replicate experiments for each antibody. (C) Genome screenshot showing H3K9me2 enrichment for 10-kb running windows in WT oocytes from mice aged 15 and 25 d. Y-axis scaling represents Log2RPKM centered around log2RPKM = 2.5. Annotation tracks highlight oocyte transcripts (forward in red, reverse in blue), CpG islands, oocyte DNA methylated (red) and unmethylated (blue) domains, and H3K9me2-enriched domains (defined as Log2RPKM > 2.5 in d25 GV oocytes). (D) Boxplots showing relative enrichment over input of H3K9me2 ChIP-seq libraries. Dots represent individual samples. (E) Probe trend plot showing loss of H3K9me2 enrichment in Ehmt2 cKO and Ehmt1/2 cDKO oocytes compared with WT and control oocytes in H3K9me2-enriched domains but not in random domains.

