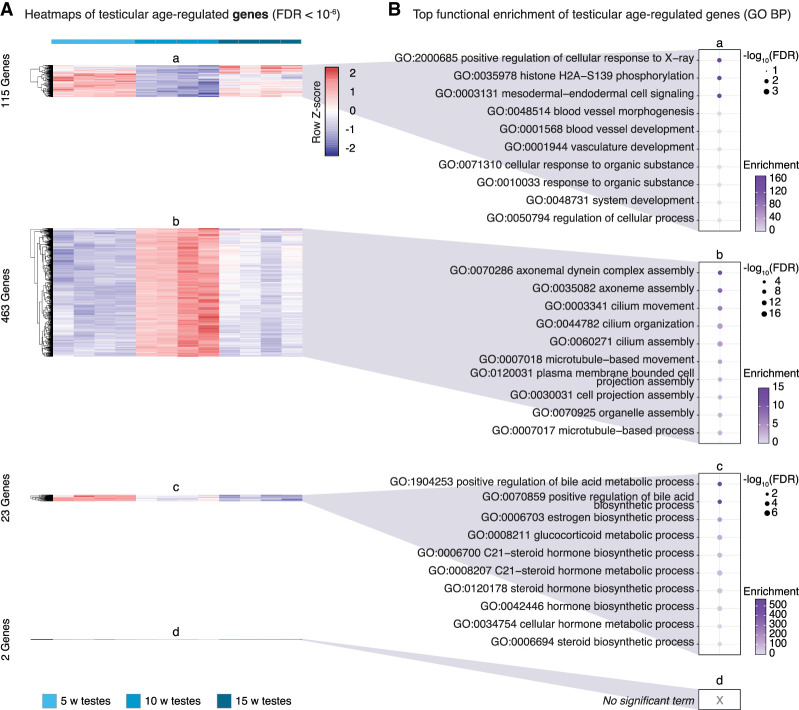
Figure 3.
Differential gene expression and GO biological process functional enrichment analysis with testicular aging. (A) Heatmaps of gene expression for genes significantly regulated with age in aging killifish testes by DESeq2 LRT (FDR < 10−6). Groups as defined in Figure 2A. (B) Functional enrichment analysis for each cluster shown in A, showing the top 10 significant GO “biological process” terms (FDR < 5%) (for complete list, see Supplemental Table S3D). Genes up-regulated in middle-aged testes are enriched for spermatogenesis-related terms. Cluster d had too few genes for enrichment analysis. (FDR) False-discovery rate, (enrichment) fold enrichment over background.

