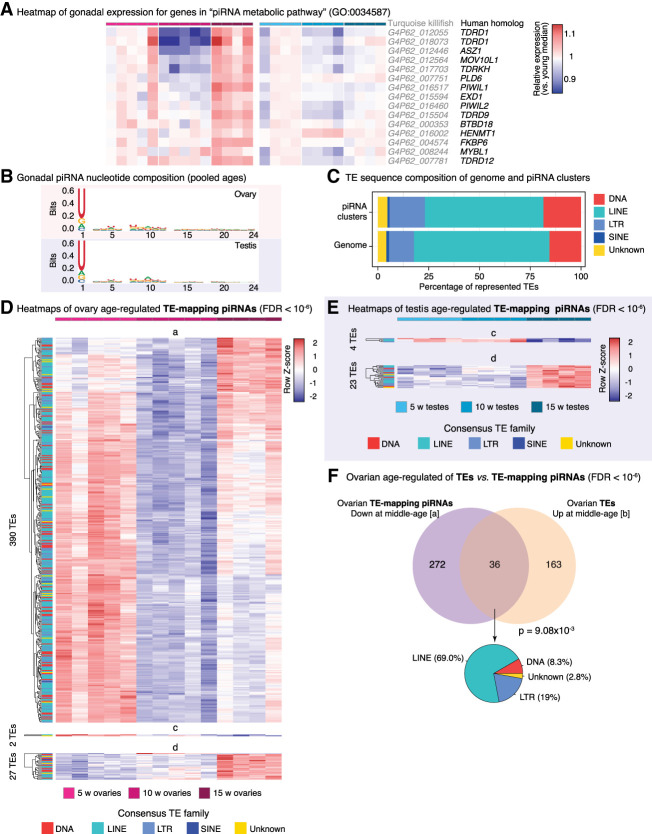
Figure 5.
PIWI pathway activity and piRNA abundance characterization in aging turquoise killifish gonads. (A) Heatmaps of normalized gene expression from ovaries and testes with aging in the GO term “piRNA metabolic pathway.” Killifish gene names and their best human homologs are indicated. Rows were normalized by the median expression level in the cognate young gonad to facilitate visualization of age-related changes. (B) Sequence logo plots of piRNA nucleotide composition from ovaries and testes. As expected, killifish piRNAs show a strong 1U bias. Note a slight 10A bias, consistent with active ping-pong biogenesis. (C) Stacked barplots depicting the TE family composition of piRNA clusters and reference genome, as a percentage of identified elements. (D) Heatmaps of TE-targeted piRNA abundance for TEs significantly regulated with age in aging killifish ovaries by DESeq2 LRT (FDR < 10−6). TE family is color-coded for each row. (E) Heatmaps of TE-targeted piRNA abundance for TEs significantly regulated with age in aging killifish testes by DESeq2 LRT (FDR < 10−6). (F) Venn diagram of overlap between TE-mapping piRNAs significantly up-regulated in middle-aged ovaries (pattern a; see D) and TEs significantly down-regulated in middle-aged ovaries (pattern b) (see Fig. 4C). Significance for larger overlap than expected calculated using Fisher's exact test, compared with TEs detected in both analyses. A pie chart of the composition of “consistent” TEs is also reported.

