Figure 6.
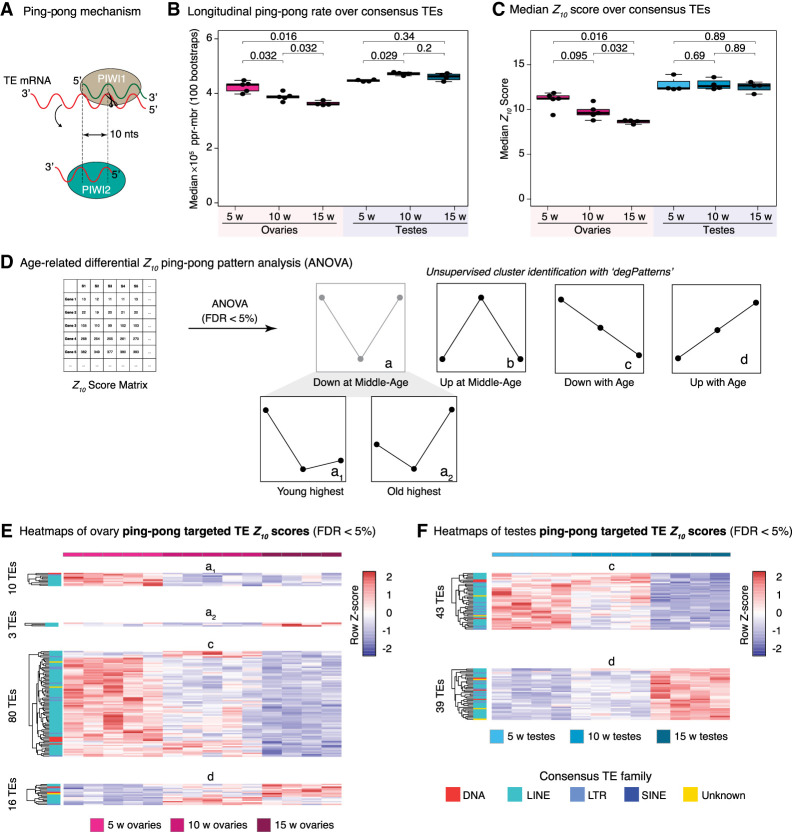
Analysis of ping-pong biogenesis in aging turquoise killifish gonads. (A) Explanatory diagram of ping-pong biogenesis. PIWI1 (the PIWI protein loaded with “primary” piRNAs complementary to TEs) binds to and cleaves TE mRNA. The cleaved TE mRNA is loaded into PIWI2 (the PIWI protein loaded with cleaved TEs, or “TE-derived secondary” piRNAs). PIWI proteins always cleave targets 10 bp from the 5′ end of the piRNA. This mechanism, known as ping-pong biogenesis, will generate complementary piRNAs with a 10-bp overlap. (B) Boxplot showing the median frequency of 10-bp overlaps for 1 million piRNA reads over 100 bootstraps per sample generated by PPmeter. (ppr-mbr) Ping-pong reads per million bootstrapped reads. Nonparametric Wilcoxon rank-sum tests were used to test for differences between age groups. (C) Boxplot showing median Z10-scores over consensus TEs for each sample. Z10-scores are an alternative ping-pong measure. Nonparametric Wilcoxon rank-sum tests were used to test for differences between age groups. (D) Schematic for analysis of differential Z10-score patterns with gonadal aging. Z10-scores were generated for each consensus TE in FishTEDB in each sample. ANOVA was run to detect significant differences in Z10-score between ages within each sex (FDR < 5%). Significant TEs were assigned to patterns based on expression dynamics aligning to the broad groups defined in Figure 2A, and two new subgroups showing minimal expression at middle-age (a1 and a2), with the highest Z10-scores in the young samples and old samples, respectively. (E) Heatmaps of differential Z10-scores with age in aging killifish ovaries by ANOVA (FDR < 5%). (F) Heatmaps of differential Z10-scores with age in aging killifish testes by ANOVA (FDR < 5%). Cognate TE family is color-coded by row.

