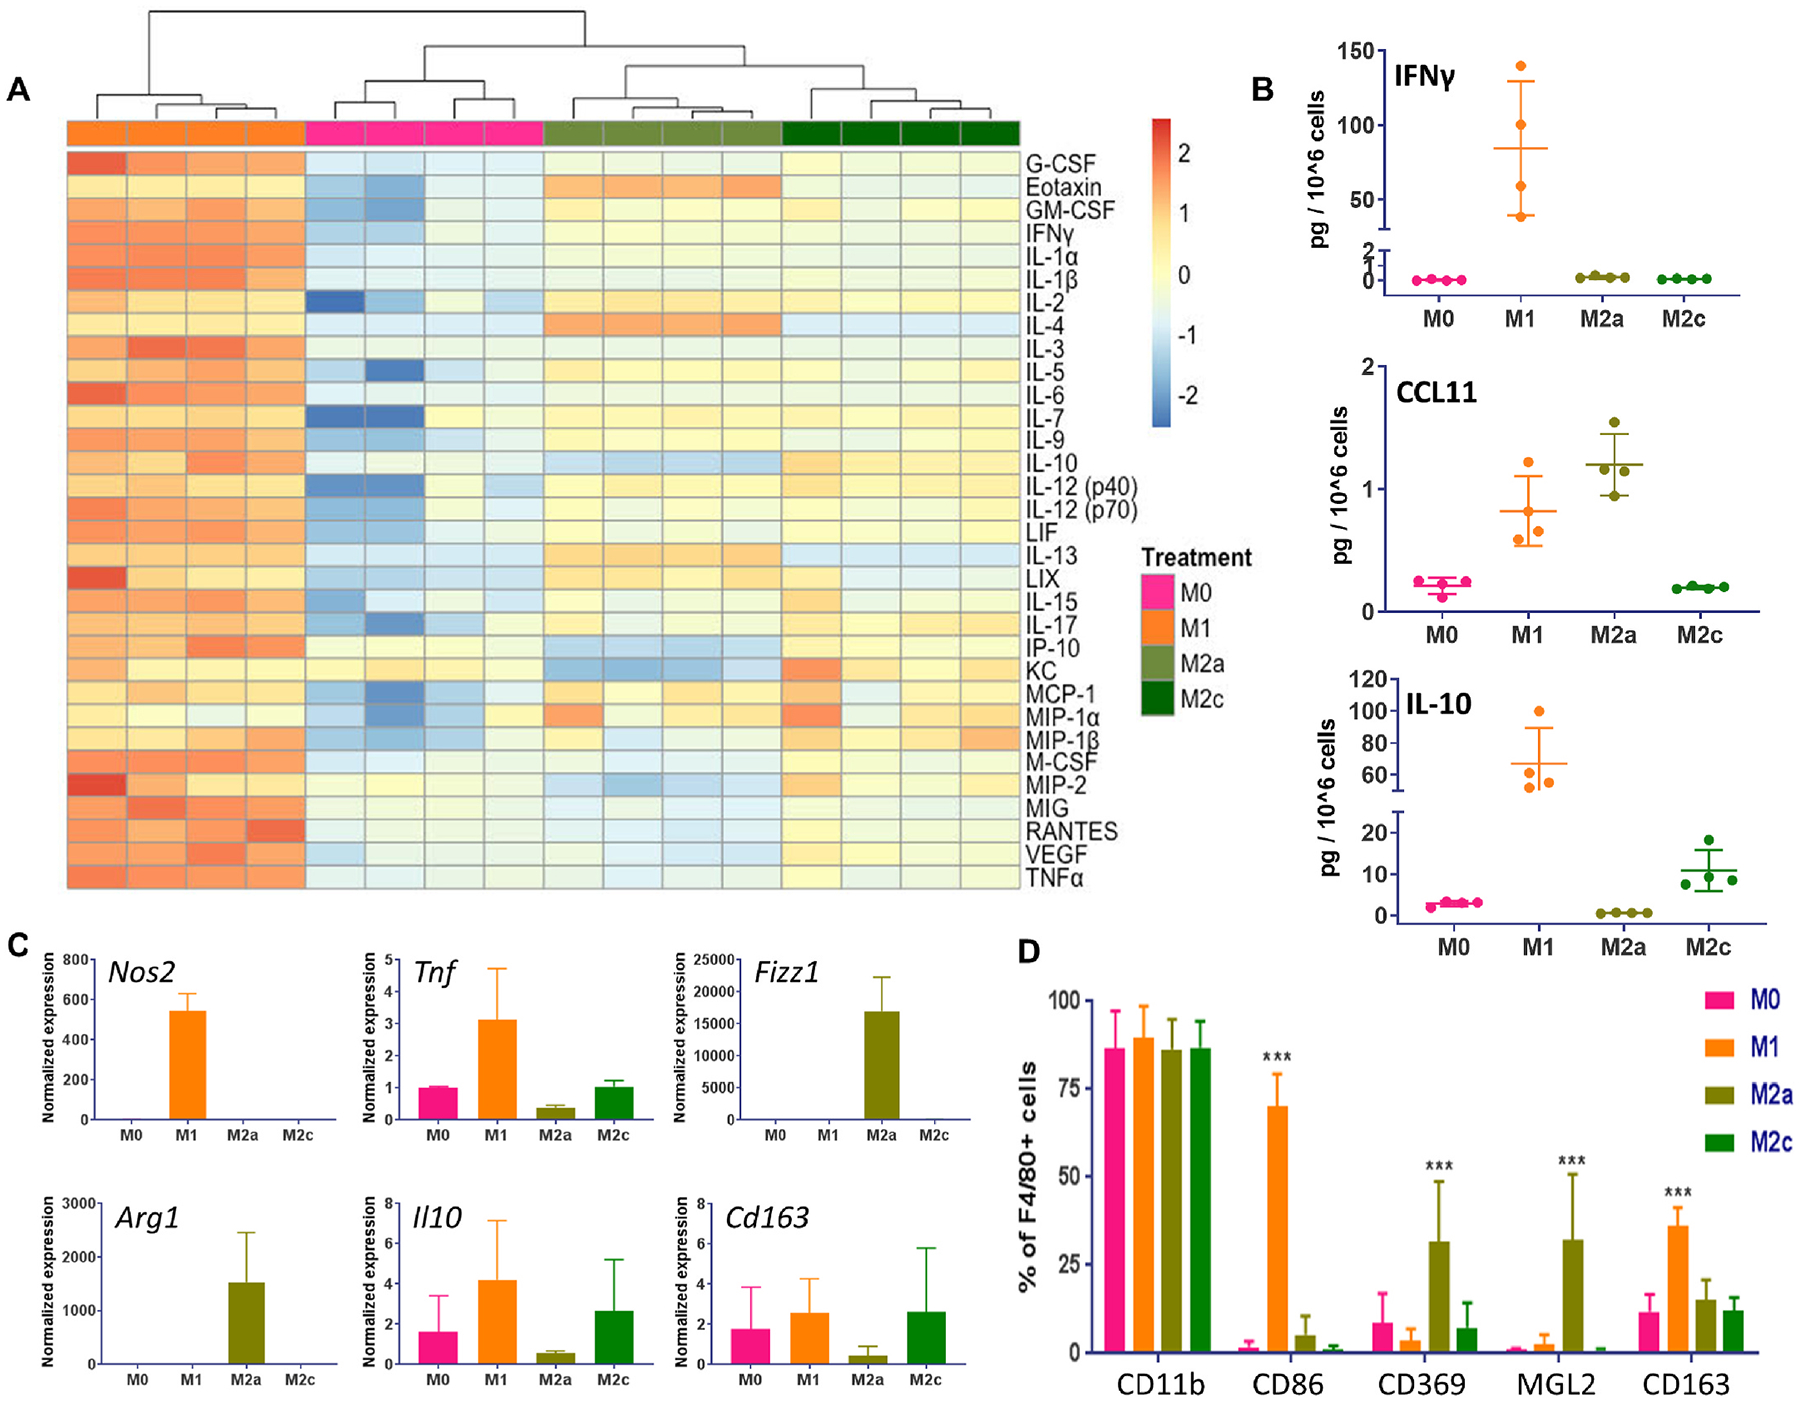
Fig. 2. Primary bone marrow derived macrophages polarization and characterization.

(A) Heatmap of 32 cytokines and chemokines measured with a Luminex assay in the concentrated conditioned media of polarized macrophages, n = 4, values were log2 transformed, scaled per row and clustered using Euclidian distance hierarchical clustering. Orange denotes high and blue low expression with light/dark shades representing smaller/larger levels of expression. (B) Selected set of cytokines and chemokines measured in polarized macrophages’ secretome, n = 4. (C) Quantitative RT-PCR analyses of macrophage marker genes Nos2, Tnf, Fizz1, Arg1, Il10 and Cd163 with Actb used as housekeeping gene, n = 2. (D) Quantification of multicolor flow cytometry staining of polarized macrophages (F4/80+ cells) for surface markers CD11b, CD86, CD369, MGL2 (CD301b) and CD163, n = 5, two-way ANOVA with Tukey’s post-hoc test, ***P < 0.001 compared to the other polarization states. Data are represented as mean ± s.d.
