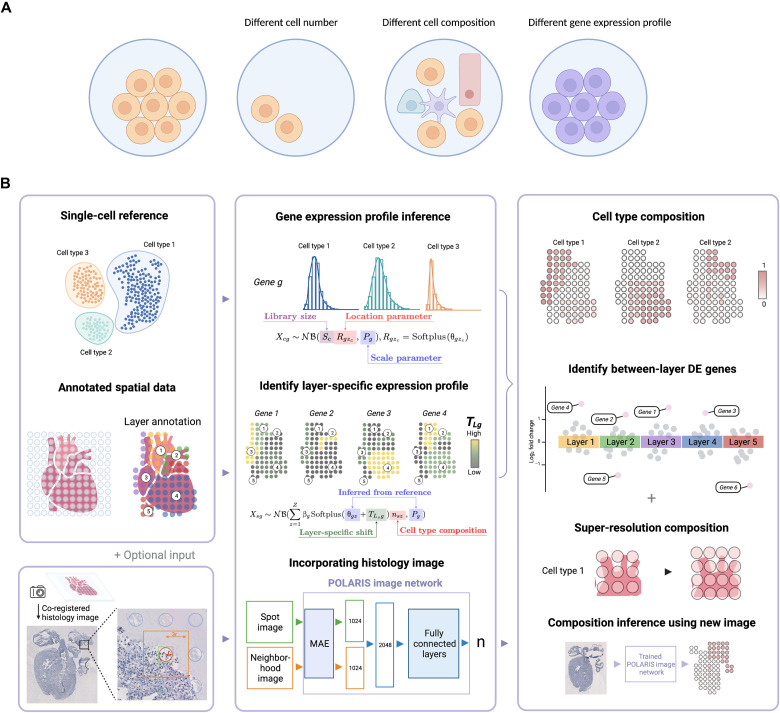
Fig. 1. POLARIS overview.
(A) Three reasons that can explain gene expression variation across spots. Each circle represents a spatial spot. Compared to the leftmost spot, the three spots on the right differ primarily in cell number, cell composition, and gene expression profile. (B) POLARIS workflow. POLARIS takes as input single-cell reference and annotated spatial data, infers cell type–specific gene expression profiles, and identifies layer-specific expression profiles. When a co-registered histology image (as an optional input) is provided, POLARIS will additionally train an image network. The output of POLARIS includes inferred spot-level cell type composition, identified LDE genes, and a pretrained POLARIS image network that can be applied to independent images. This figure is created via BioRender.

