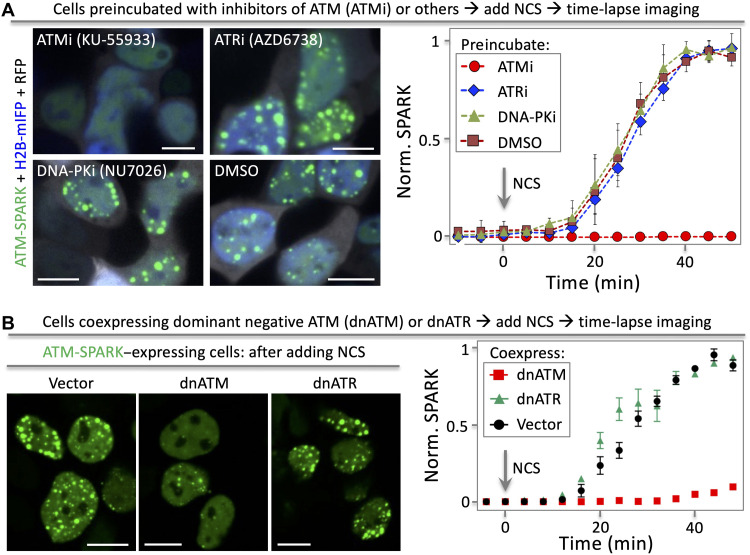
Fig. 2. ATM-SPARK specifically reports ATM activity but not the closely related ATR or DNA-PK.
(A) Fluorescence images of cells showing that ATM-SPARK response is blocked by inhibitors of ATM but not ATR or DNA-PK. HEK293 cells were cotransfected with ATM-SPARK and mIFP-H2B. The cells were preincubated with inhibitors of ATM, ATR, or DNA-PK. Then, the cells were treated with NCS, followed by time-lapse imaging. (B) Fluorescence images of cells showing that ATM-SPARK response is blocked by dnATM but not dnATR. Data are means ± SE (n = 30 cells). Scale bars, 10 μm.

