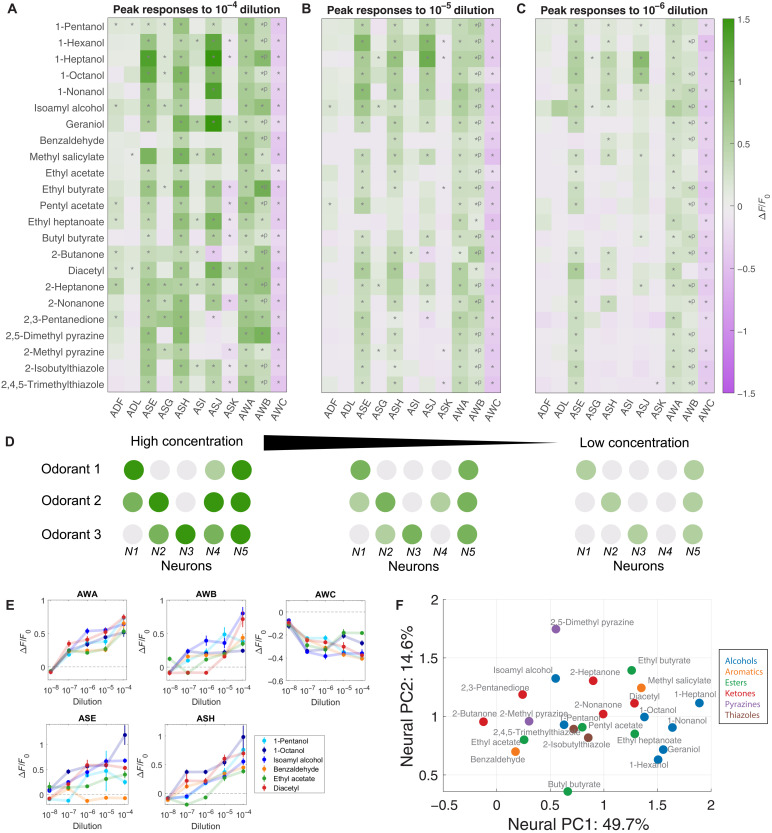
Fig. 2. Ensemble responses to a broad odorant panel.
Average peak responses of the 11 chemosensory neurons to odorants at (A) high concentration (10−4 dilution), (B) medium concentration (10−5 dilution), and (C) low concentration (10−6 dilution). Peaks were computed from a time window from onset of odor delivery to 10 s after odor removal. Responses are reported as ∆F/F0. Significant responses (q ≤ 0.01, two-tailed, paired t tests) are indicated with stars. Significant OFF responses are indicated with *P. Most odorants elicit significant responses from unique neuron combinations. (D) Schematic of coding strategy observed in (A) to (C). Different odorants evoke responses in distinct subsets of sensory neurons. Responses are generally stronger at high concentrations. Additional neurons are activated as concentration increases. (E) Dose responses of the peak responses of AWA, AWB, AWC, ASE, and ASH are diverse, with distinct concentration-dependent curves in response to different odorants. See fig. S3F for dose responses of the other six sensory neurons. Error bars are SEM. (F) PC space built from standardized peak average neural responses. Chemical class is indicated by color. Some odorant classes, such as alcohols and ketones, have more similar neural representations, while other odorant classes, such as esters, have more diverse representations. See fig. S3I for PC loadings.

