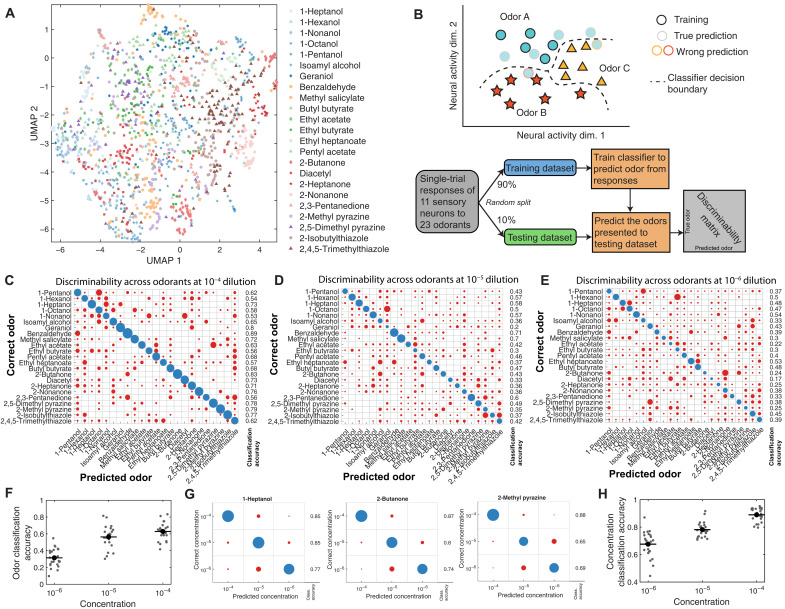
Fig. 5. Representative comparisons of single-trial odorant responses.
(A) Low-dimensional UMAP representation of single-trial neural responses to all 23 odorants at 10−4 dilution. Responses to any given odorant generally cluster together. (B) Schematic of the multiclass classifier used for theoretical discriminability analysis of single-trial responses. The classifier was trained to predict odor identity from the peak responses of the ensemble of sensory neurons, generating a discriminability matrix. (C) Linear discriminability analysis of single-trial peak responses to high-concentration (10−4 dilution) odorants, with the presented odorant on the y axis and the classified odorant on the x axis. Circle size indicates the number of trials, with correct classifications colored blue and incorrect classifications colored red. The fraction of correctly classified trials for each odorant is to the right. Most of the single trials are correctly classified for each odorant. At lower concentrations, 10−5 dilution (D) and 10−6 dilution (E), classification accuracy diminishes. This is summarized in (F), a scatterplot of multiclass classification accuracy at different concentrations (C to E). (G) Within a given odorant (three examples shown), the concentration of the given odorant can be correctly classified on the basis of individual peak responses. (H) Across all odorants, concentration classification accuracy at different concentrations is shown.

