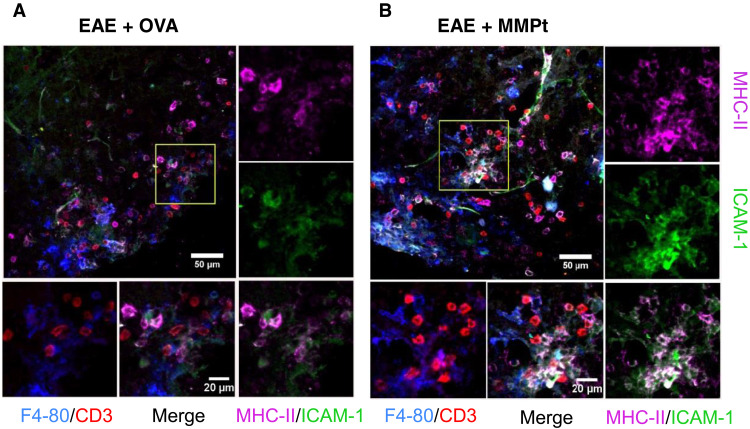
Fig. 3. MMPt up-regulates MHC-II and ICAM-1 expression in macrophages for T cell therigen cross presentation in the CNS of MOGp-induced C57BL/6 EAE mice.
Fluorescent microscopic images of axial sections of the mouse spinal cords with a clinical score of 3 EAE. Staining: F4/80+ macrophages in blue, CD3+ T cells in red, ICAM-1 in green, MHC-II in magenta, and ICAM-1 and MHC-II merge as indicated. Post-IV injection of 500 μg of (A) OVA or (B) MMPt for 3 hours, with ×20 magnification. Scale bars, 50 μm. The insets are presented on individual color and merged channels as indicated flanking on the right and bottom of each representative images at ×40 magnification. Scale bars, 20 μm.

