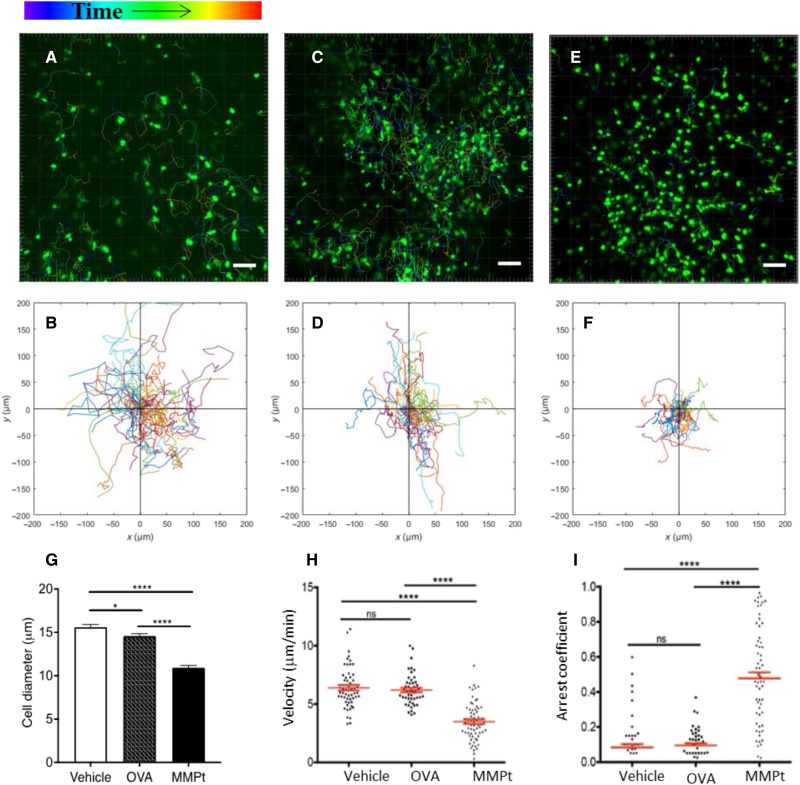
Fig. 4. MMPt-loaded macrophages arrest reactive T cells in the CNS of MOGp-induced, CXCR6-GFP-Tg, and C57BL/6 EAE mice.
Intravital microscopic imaging analysis on responses of the encephalitogenic T cells with therigen-loaded APCs in the CNS of EAE mice. Migration distance and velocity of endogenous CXCR6-GFP+ T cells were recorded for 3 hours after antigen administrations in a clinical score of 3 EAE mice (A to F). Antigen stimulations: saline vehicle (A and B), OVA (C and D), or MMPt (E and F). The images represent typical observations of T cell displacement view in the field of the spinal cord chamber, with its two-dimensional tracking data correspondingly shown in (B), (D), and (F). Scale bars, 50 μm. Data are representative of 60 to 80 tracked cells from two mice per treatment in two independent experiments. (G) Cell size in diameters measured from the retrieved images is presented as group means and SEM (error bars). *P < 0.05 and ****P < 0.001 (one-way ANOVA with Tukey’s multiple comparisons). Cell moving velocity data are plotted for showing the migration rate of CXCR6 T cells over the 3-hour courses after injections of vehicle, OVA, or MMPt, as indicated in (H). Arrest coefficient of T cells with same parameters as (H) is shown in (I). T cell velocity and arrest coefficients were analyzed using two-tailed unpaired t test shown means (red horizontal lines) ± SD (red bars). ns, not significant; ****P < 0.0001.

