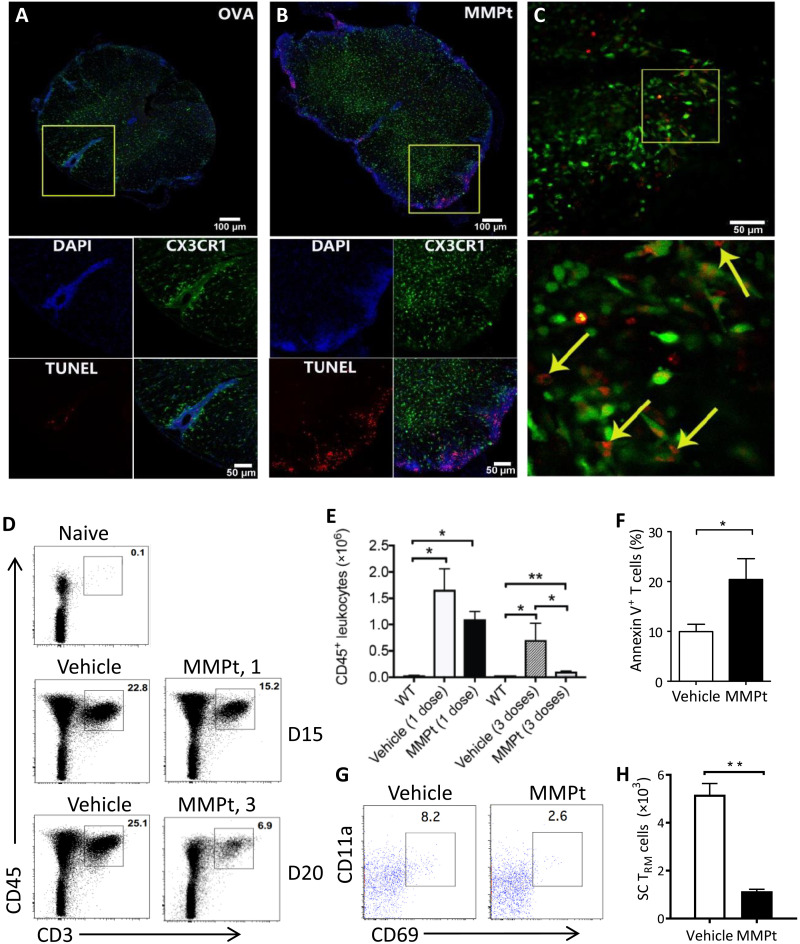
Fig. 5. MMPt induces RICD of the sensitive T cells in blunting inflammatory responses in MOGp-induced C57BL/6 EAE mice.
Confocal microscopy imaging with TUNEL staining of axial section of the spinal cords from CX3CR1-GFP-Tg mice with a clinical score of 3 EAE that were IV injected with (A) OVA or (B) MMPt for 20 hours. Channel presentations are 4′,6-diamidino-2-phenylindole (DAPI; blue), microglia (CX3CR1; green), TUNEL (red). Scale bars, 100 μm (top) and 50 μm (bottom). (C) Ex vivo imaging of the spinal cords isolated from CX3CR1-GFP mice at a clinical score of 3 EAE. In addition, 24 hours after MMPt injection, the mice were adoptively transferred with in vitro Dye 670–labeled, activated MOG35–55-specific 2D2-TCR-Tg T cells. Scale bars, 50 μm. (Bottom) Inset: A magnification of ×16. Arrows indicate the Dye 670–labeled apoptotic T cell fragments within microglia. (D) Frequency of CD3+CD45+ T cells isolated from the CNS of a clinical score of 3 EAE mice after treatment with one dose (middle) or three doses (bottom) control vehicle or MMPt. (E) Quantification of CD45+ leukocytes from (D), average counts of three mice. WT, normal non-EAE mice. (F) Annexin V staining of T cells isolated from the spinal cords 24 hours after injection of vehicle or MMPt in mice with an EAE clinical score 3. (G) Frequency of CD69+CD11a+ TRM cells isolated from the CNS of score-3 EAE mice that had received three doses of vehicle or MMPt treatments. (H) Quantification of (G) after three doses of vehicle or MMPt, average counts from three mice. Data were analyzed using two-tailed unpaired t test (shown means + SD); *P < 0.05 and **P < 0.01.

