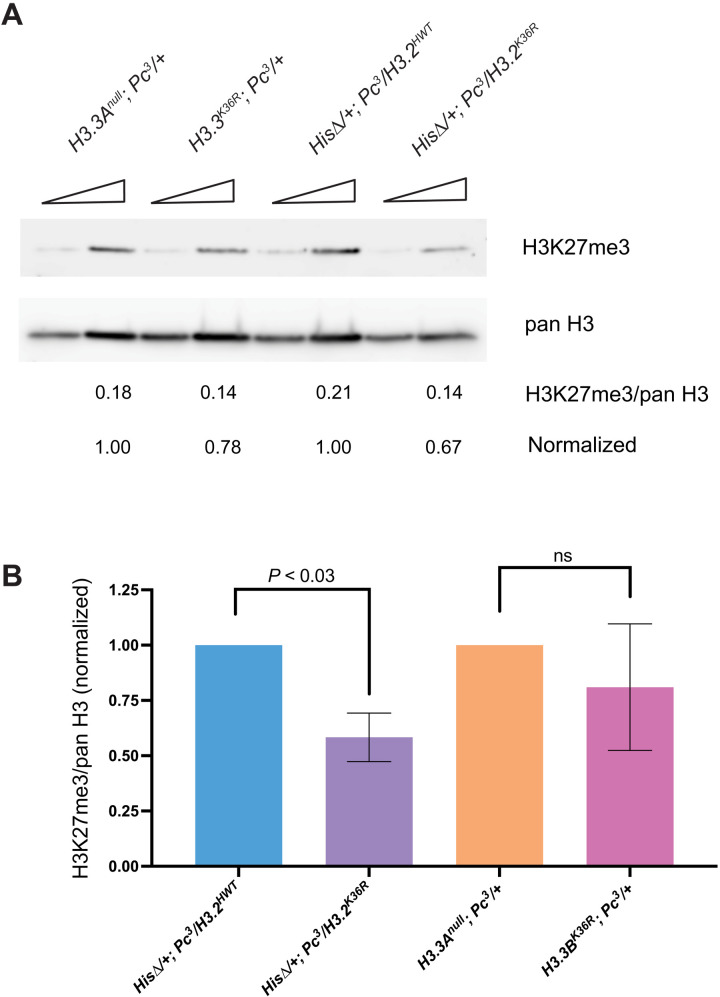
Fig. 3. Western blot analysis of H3K27me3 levels in adult heads.
H3.2 and H3.3 K36R mutants were maintaned in a sensitized Pc3 genetic background. (A) Western blotting with anti-H3K27me3 and anti–pan H3 were performed using adult head extracts, loading either 40 or 80 μg of protein per lane. Three independent experiments were performed and imaged; a representative blot is shown. Mean pixel intensity was calculated for each band using equal-sized areas, and a ratio of H3K27me3/pan H3 was calculated for each biological replicate from the 80-μg lane. (B) For each independent experiment, the H3K27me3/pan H3 ratio of mutant genotypes was normalized to its control (His∆/+;H3.2K36R/Pc3 to His∆/+;H3.2HWT/Pc3 and H3.3BK36R;Pc3/+ to H3.3Anull;Pc3/+). For each genotype, the normalized mean and SD of H3K27me3/pan H3 values of all three experiments was plotted. Statistical significance between raw H3K27me3/H3 ratios was assessed by paired one-way ANOVA (within experiments), followed by Friedman tests individually comparing mutant genotypes to controls. P values are directly noted on the graph.

