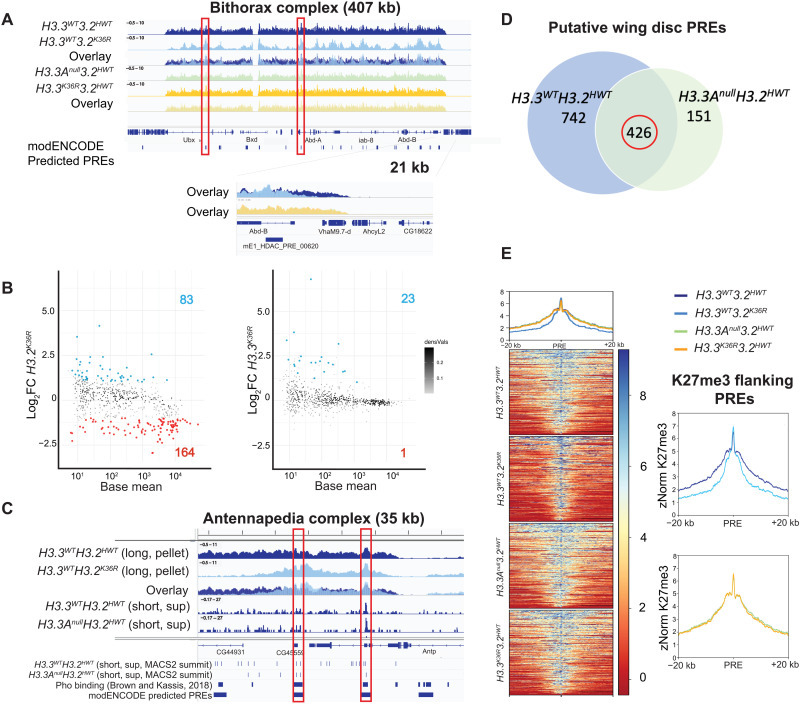
Fig. 4. Mutation of H3.2K36, but not H3.3K36, impairs H3K27me3 in Pc domains.
H3K27me3 CUT&RUN profiling in WL3 wing discs (three replicates per genotype). All browser tracks, metaplots, and heatmaps used z score normalization (A) IGV (Integrative Genomics Viewer) track of the BX-C from pellet. Individual and overlay tracks for H3.3WTH3.2K36R with H3.3WTH3.2HWT control, and H3.3K36RH3.2HWT with H3.3AnullH3.2HWT control. Below the genome annotation are modENCODE predicted PREs. Red boxes indicate PREs exhibiting WT H3K27me3, with H3K27me3 declining in the H3.3WTH3.2K36R mutant in flanking regions. The Abd-B promoter is shown at higher magnification. (B) Differential peak analysis of broad H3K27me3 domains using DESeq2 (n = 629). MACS2 broad peak intervals within 10 kb were merged before DESeq2 (see fig. S8). Points with adjusted P value > 0.05 and a log2 fold change (Log2FC) > |1| colored (red, down-regulated; blue, up-regulated). Log2FC is computed relative to appropriate control. (C) IGV track of H3K27me3 from the Antennapedia complex using long-fragment reads (150 to 700 bp). Tracks are shown for the H3.3WTH3.2K36R mutant and H3.3WTH3.2HWT control, including overlay. Below overlay are subnucleosomal (20 to 120 bp) tracks from control genotypes. BED tracks represent individual MACS2 narrow peak summits, Pho-binding sites as determined in (59), and modENCODE-predicted PREs. Red boxes indicate correspondence between features. (D) To identify putative wing disc PREs, intervals containing MACS2 peak summits ± 150-bp overlapping Pho-binding regions (see Materials and Methods and fig. S8) were ascertained for each control. The number of intervals for each control is indicated in each circle. The intersection of PRE intervals identified in both controls (circled in red) was used for further analysis. (E) Heatmap and metaplots of H3K27me3 signal at putative PREs and 20-kb flanking regions determined in (D) (n = 426), calculated from merged bigwig files from each genotype. To the right, each mutant genotype is compared directly to its respective control.

