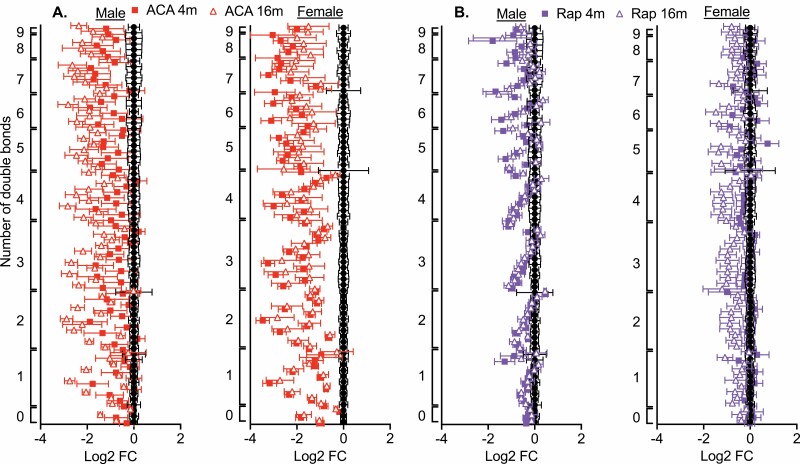
Figure 4.
Log2 fold change in TAG species following ACA or RAP treatment. UM-HET3 mice were sampled at 22 months of age after treatment with either ACA (A) or RAP (B) from 4 months or 16 months of age. Each symbol (squares or triangles) represents the Log2 fold change in abundance (± SEM) for a specific TAG species, calculated as a change from the average abundance of untreated control values (black circles). Data are stratified by sex. TAG species are ordered accorded to number of double bonds, and within each double bond group, species are ordered with higher chain lengths higher on the y-axis (see Supplementary Data Set for changes in specific species). Group numbers: n = 8 per treatment group. ACA = acarbose; RAP: rapamycin; TAG = triacylglyceride; SEM = Standard Error of the Mean.

