Figure 5. Community diversity is associated with increases in focal species polymorphism over short time lags and net gene loss in dense gut microbiome time series.
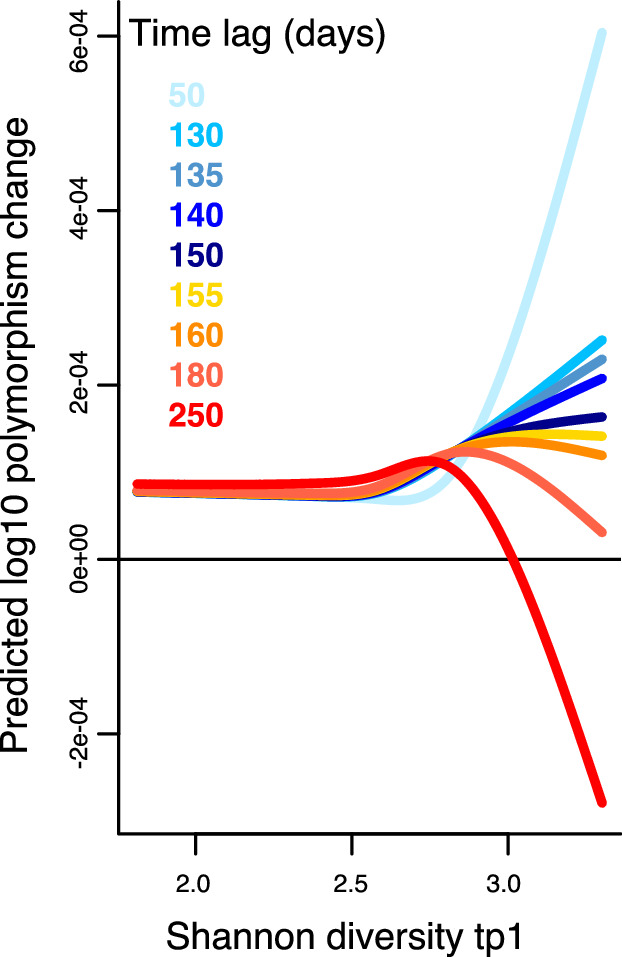
(A) Results of a generalized additive model (GAM) predicting polymorphism change in a focal species as a function of the interaction between Shannon diversity at the first time point and the time lag (days) between two time points in data from Poyet et al. The response (Y-axis) was log-transformed in the Gaussian GAM. Results of generalized linear mixed models (GLMMs) predicting (B) number of genes lost and (C) number of genes gained between two time points in a focal species as a function of the interaction between Shannon diversity at the first time point and the time lag between the two time points. (D) Results of the GLMM predicting the number of genes gained in a focal species as a function of the interaction between rarefied species richness at the first time point and the time lag between the two time points. The illustrated time lags correspond to the first quartile (50 days), the median (130 days), and the third quartile (250 days). See Supplementary file 1h and i and Supplementary file 2 section 11 for detailed model outputs. These analyses are based on data from 15 bacterial species across four stool donors from Poyet et al. Only statistically significant relationships are plotted. Non-significant relationships are not shown: the GAM predicting polymorphism change as a function of rarefied richness (p>0.05) and the GLMM predicting the number of genes lost as a function of rarefied richness (p>0.05).

Figure 5—figure supplement 1. Results of a generalized additive model (GAM) predicting polymorphism change in a focal species as a function of the interaction between Shannon diversity at the first time point and the time lag (days) between two time points in the Poyet time series.