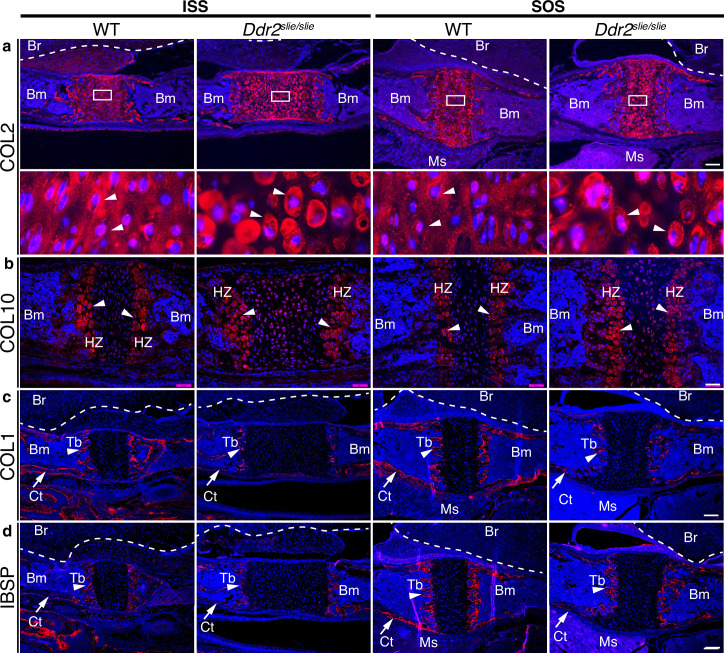
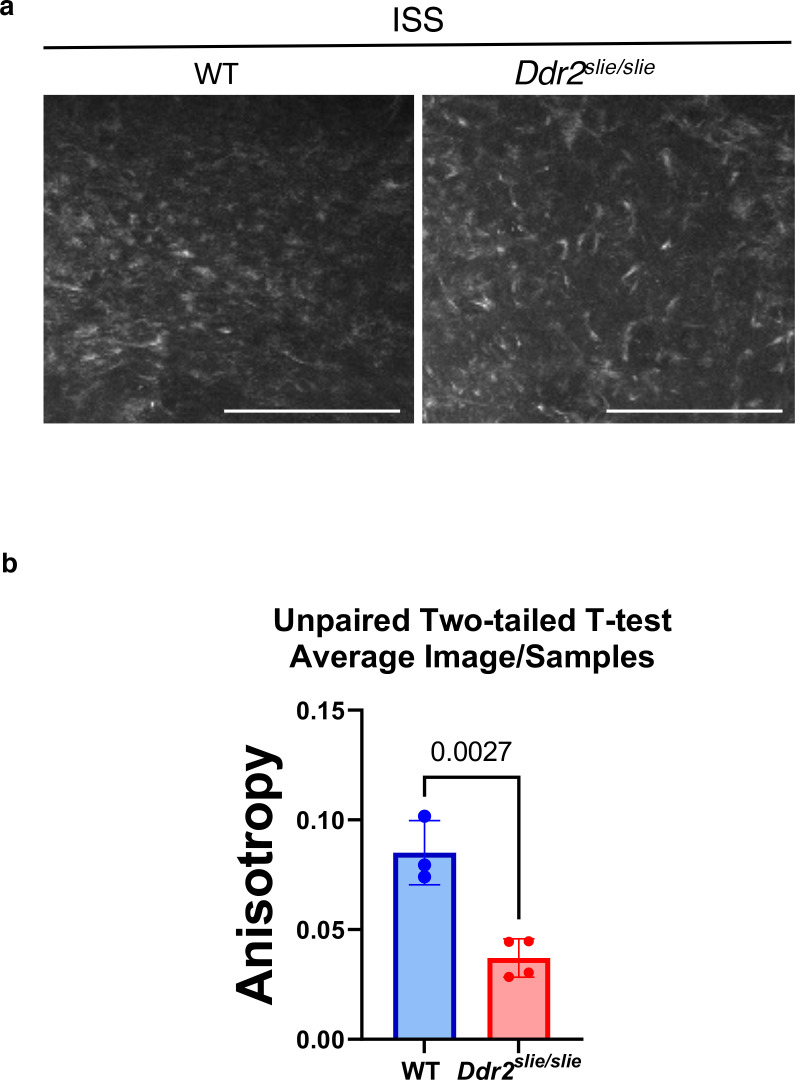
Figure 3. ECM defects in Ddr2-deficient synchondroses.
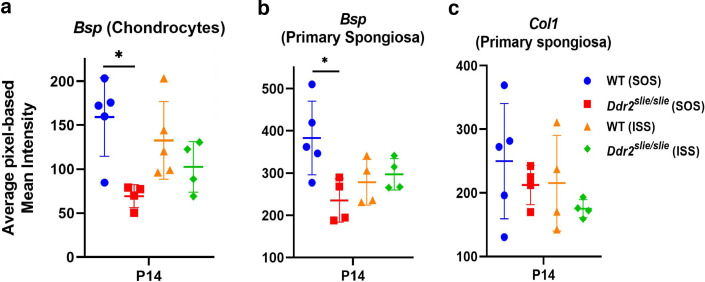
(a-d) Immunofluorescent staining of ISS and SOS sections from 2-week-old WT and Ddr2slie/slie synchondroses. (a) Representative images of COL2 immunostaining (red) in ISS and SOS showing homogenous distribution around chondrocytes in WT synchondroses, while Ddr2slie/slie mice showed uneven, ring-like immunostaining around chondrocytes (white arrowheads). Boxed region is shown in higher magnification (bottom). Scale bar: 200 μm. (b) Immunofluorescent images of COL10 immunostaining in the hypertrophic zone (HZ) of synchondroses showing no major changes in staining distribution between WT and Ddr2slie/slie mice. Scale bar: 50 μm. (c) Immunofluorescence images showing COL1 (red) staining in trabecular (arrowheads) and cortical (arrows) bones of the cranial base in WT and Ddr2slie/slie mice. Scale bar: 200 μm. (d) Immunofluorescent images showing IBSP (red) in trabecular (arrowheads) and cortical (arrows) bones of cranial base is decreased in Ddr2slie/slie synchondrosis compared with WT littermates. See Figure 3—figure supplement 2 for quantitation of IF staining. Scale bar: 200 μm. Cell nuclei were stained with DAPI (blue) in a–d. Bm: Bone marrow; Br: Brain; Tb: Trabecular bone; Ct: Cortical bone; Ms: Muscle.


