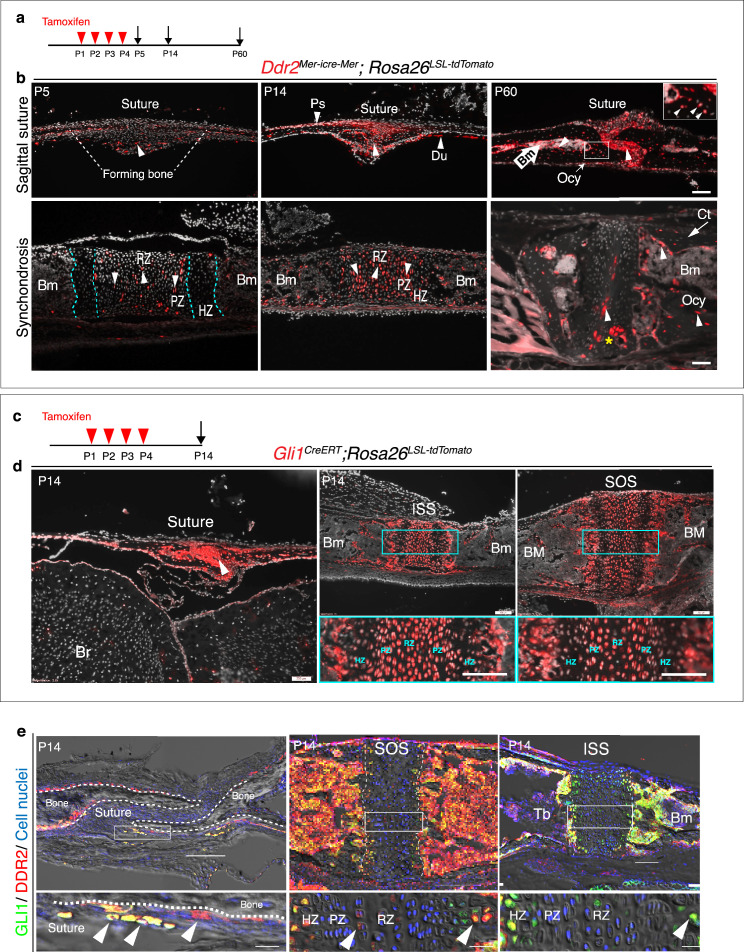
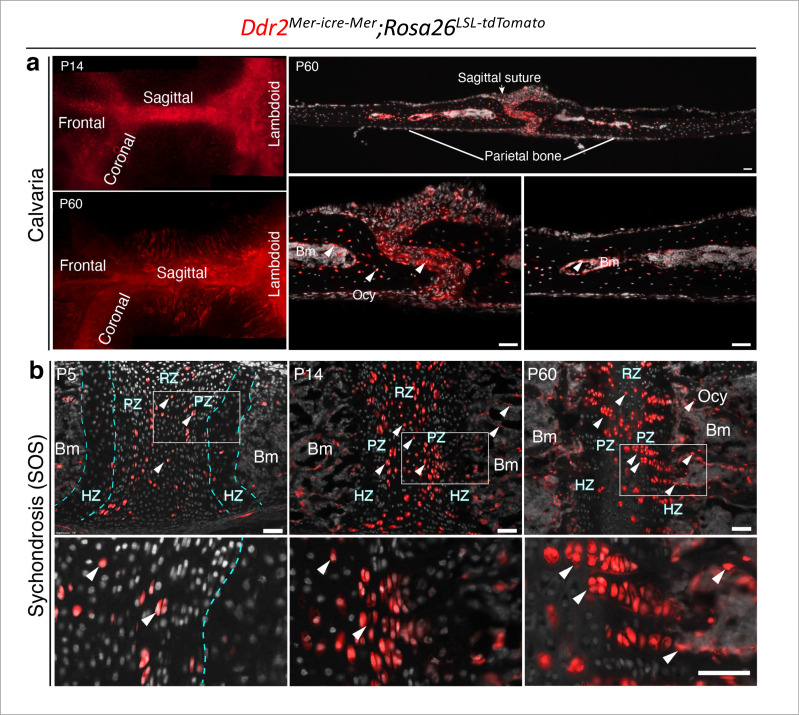
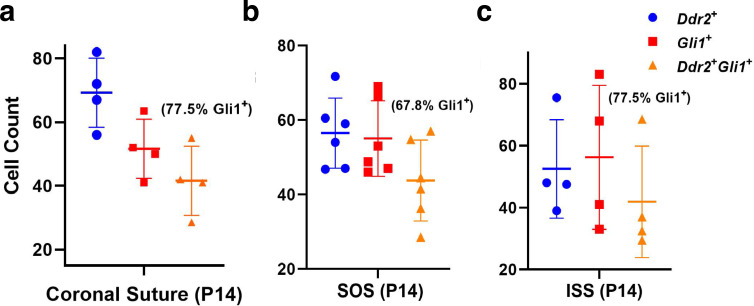
Figure 5. Ddr2mer-iCre-mer marks progenitors of the skeletal lineage during postnatal craniofacial development.
(a) Protocol used for induction of Cre-recombination and expression of tdTomato fluorescent protein (red) upon tamoxifen injection. (b) Fluorescent tdTomato on cryostat sections of calvaria (upper panel) at the postnatal P5, P14, and P60 showing labeling (white arrowheads) in suture mesenchyme, periosteum (Ps) and dura mater (Du), subsequently contributing to osteocytes (Ocy) (inset box) and bone marrow (Bm) of calvarial bones over time. Scale bar: 100 μm. Lower panel, cranial base synchondrosis (ISS) showing labeling at P5 in resting (RZ) and proliferative (PZ) chondrocyte zones, but not in the hypertrophic zone (HZ) (cyan dotted lines), consistent with X-gal staining. Lineage trace at P14 shows an increase in tdTomato + cells in all synchondrosis regions and associated bone marrow (Bm). At P60, tdTomato labeling is persistent in the middle zone and shows a clone of tdTomato labeling in proliferative and hypertrophic chondrocytes (yellow asterisk) and appears in the lining of bone marrow (Bm) and osteocytes (Ocy) of cortical bone (Ct). Scale bar: 100 μm (P14 and P60) and 50 μm (P5). Gray: cell nuclei. (c) Protocol used for induction of Cre-recombination and expression of tdTomato fluorescent protein (red) in Gli1CreERT; Rosa26LSL-tdTomato mice. (d) Fluorescent tdTomato (red) on cryostat sections of calvaria (right) and cranial base synchondroses (ISS and SOS, left) from 2-week-old Gli1CreERT; Rosa26LSL-tdTomato mice showing labeling in a similar cell population to that seen with Ddr2mer-iCre-mer. Scale bar: 200 μm (Suture; left) and 100 μm (ISS and SOS; right). Boxed region is shown in higher magnification (bottom). RZ: resting zone; PZ: proliferative zone; HZ: hypertrophic zone. (e) Representative immunofluorescence images showing Gli1 (green) and Ddr2 (red) immunostaining of coronal sutures, SOS and ISS from 2-week-old mice. Scale bar: 100 μm. Boxed region is shown in higher magnification (bottom). White arrowheads indicate co-localization. Cell nuclei were stained with DAPI (blue). Bm: Bone marrow; Tb; trabecular bone.


