. 2023 Feb 28;12:e81302. doi: 10.7554/eLife.81302

Figure 1. Identification of Aglaia-parasitic Ophiocordyceps sp. BRM1.

(A) Image of a parasite fungus growing on Aglaia odorata. (B) Multilocus phylogenetic tree of Ophiocordyceps species generated from maximum likelihood phylogenetic analysis of ITS, SSU, LSU, RPB1, and TEF1α sequences. Tolypocladium species were used as outgroups. The best DNA substitution models of ITS, LSU, SSU, RPB1, and TEF1α were calculated as TIM3ef + G4, TIM1 + I + G4, TIM3ef + I + G4, TrN + I + G4, and TIM1 + I + G4, respectively. Numbers on branches are percent support values out of 1000 bootstrap replicates. Only bootstrap values greater than 50% support are shown. Endophytes are highlighted with green dots.

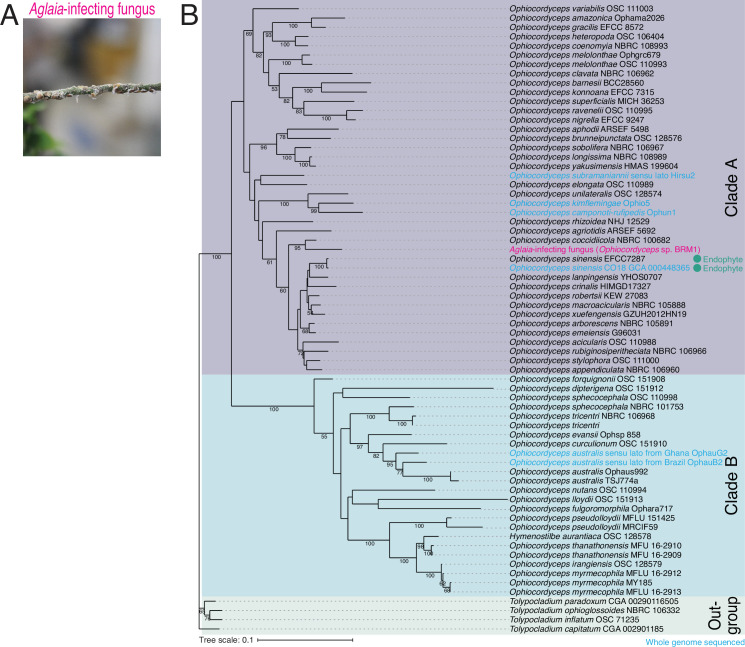
Figure 1—source data 1. Files for the full and unedited pictures corresponding to Figure 1A.

Figure 1.

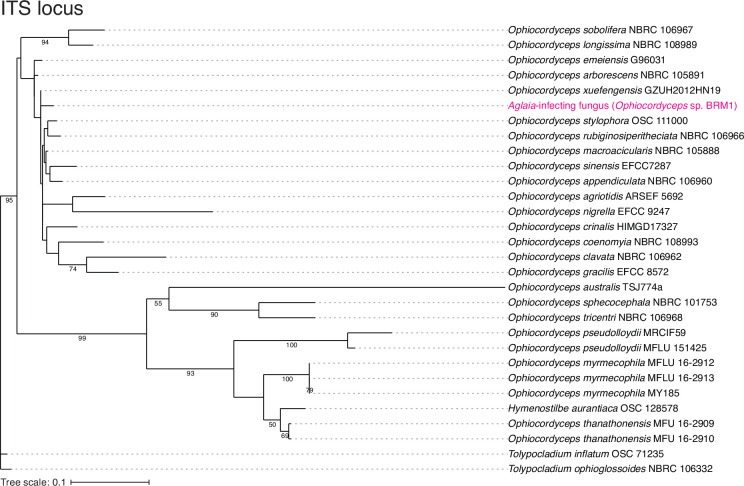
Figure 1—figure supplement 1. Assessment of Aglaia-infecting fungus species by ITS locus.

Figure 1—figure supplement 1.

The maximum likelihood best scoring trees based on ITS locus from the Ophiocordyceps species with Tolypocladium species as outgroups. Numbers at nodes are percentages of bootstrap support values out of 1000. Only bootstrap values above 50% are shown.
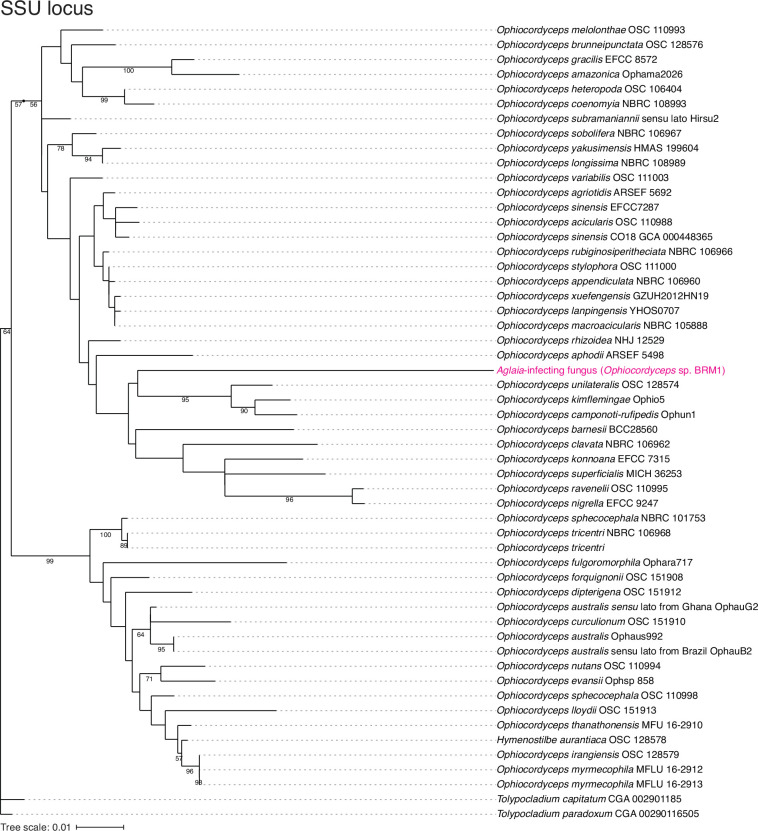
Figure 1—figure supplement 2. Assessment of Aglaia-infecting fungus species by SSU locus.

Figure 1—figure supplement 2.

The maximum likelihood best scoring trees based on SSU locus from the Ophiocordyceps species with Tolypocladium species as outgroups. Numbers at nodes are percentages of bootstrap support values out of 1,000. Only bootstrap values above 50% are shown.
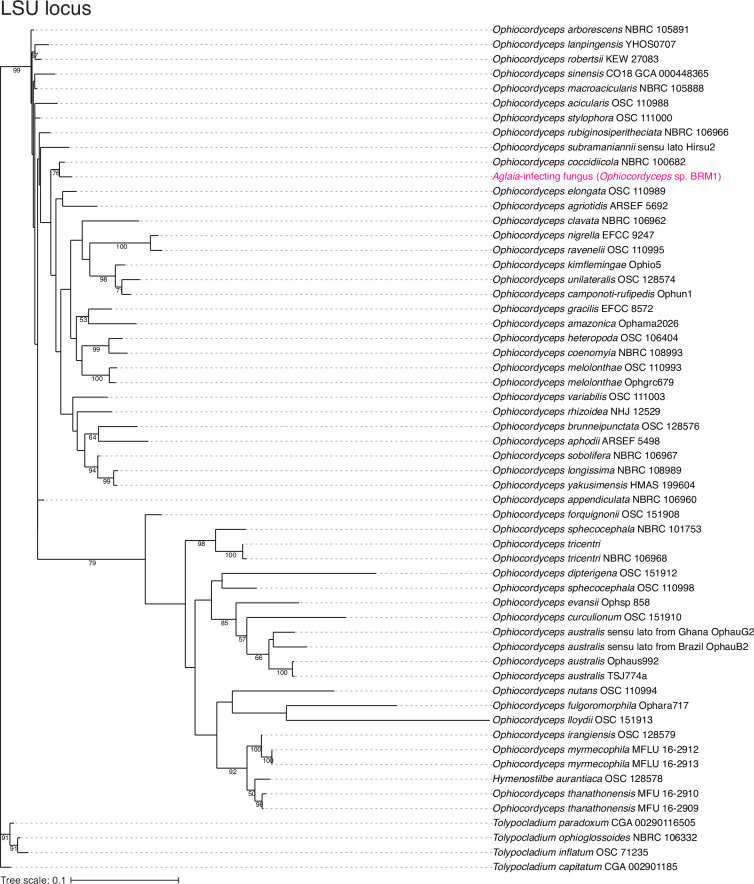
Figure 1—figure supplement 3. Assessment of Aglaia-infecting fungus species by LSU locus.

Figure 1—figure supplement 3.

The maximum likelihood best scoring trees based on LSU locus from the Ophiocordyceps species with Tolypocladium species as outgroups. Numbers at nodes are percentages of bootstrap support values out of 1000. Only bootstrap values above 50% are shown.
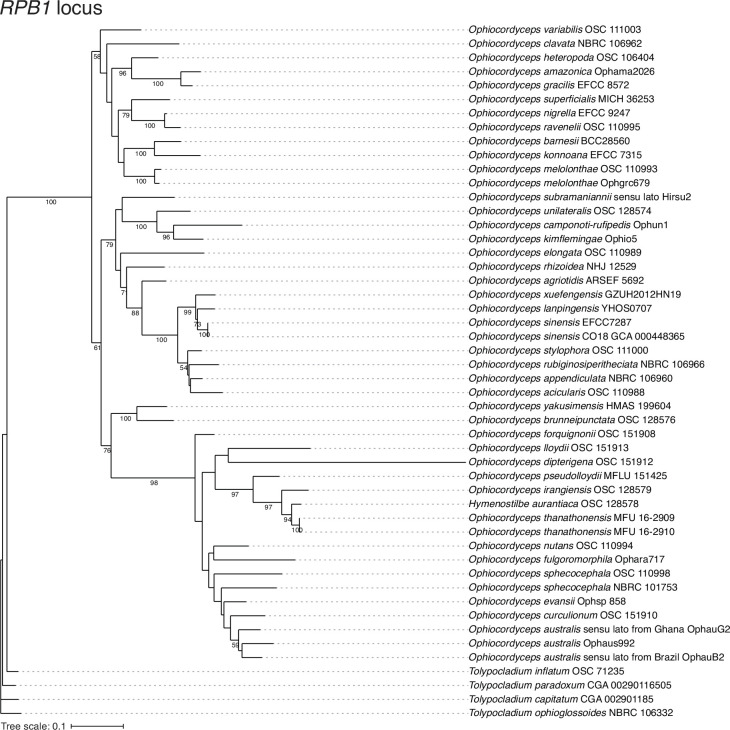
Figure 1—figure supplement 4. Assessment of Aglaia-infecting fungus species by RPB1 locus.

Figure 1—figure supplement 4.

The maximum likelihood best scoring trees based on RPB1 locus from the Ophiocordyceps species with Tolypocladium species as outgroups. Numbers at nodes are percentages of bootstrap support values out of 1000. Only bootstrap values above 50% are shown.
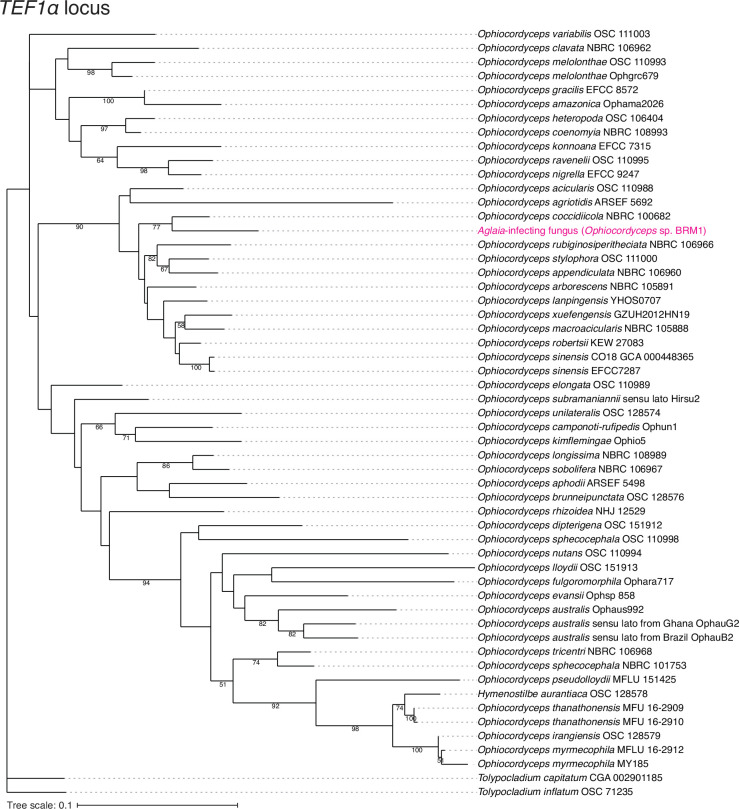
Figure 1—figure supplement 5. Assessment of Aglaia-infecting fungus species by TEF1α locus.

Figure 1—figure supplement 5.

The maximum likelihood best scoring trees based on TEF1α locus from the Ophiocordyceps species with Tolypocladium species as outgroups. Numbers at nodes are percentages of bootstrap support values out of 1000. Only bootstrap values above 50% are shown.