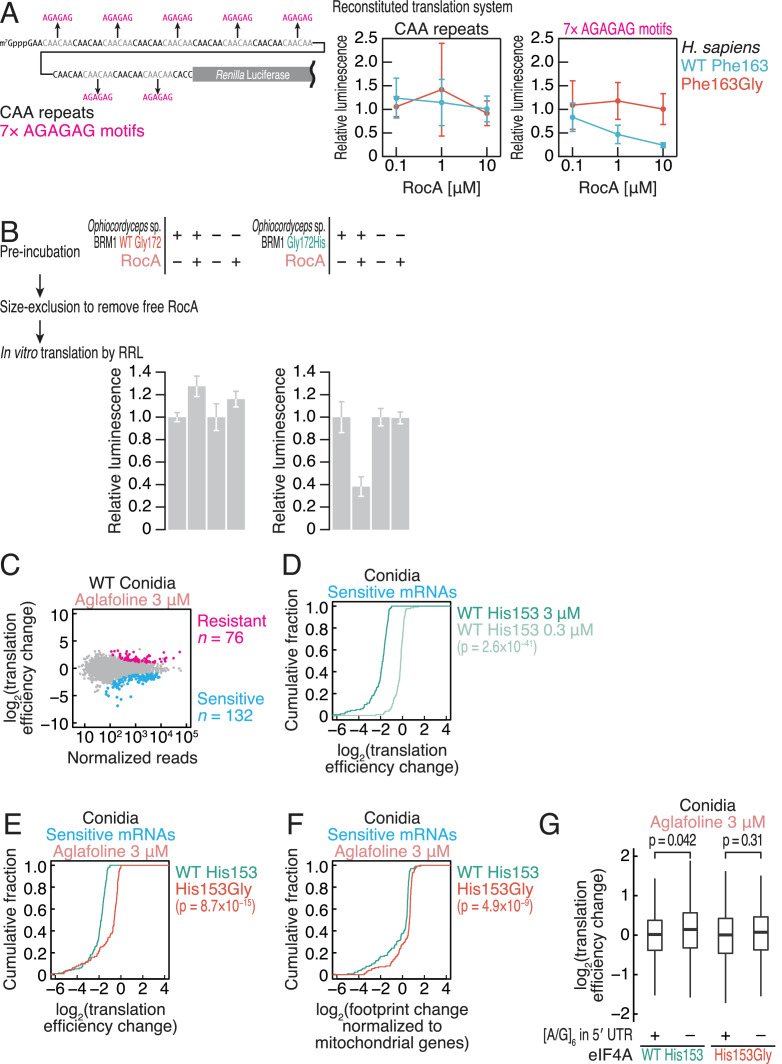
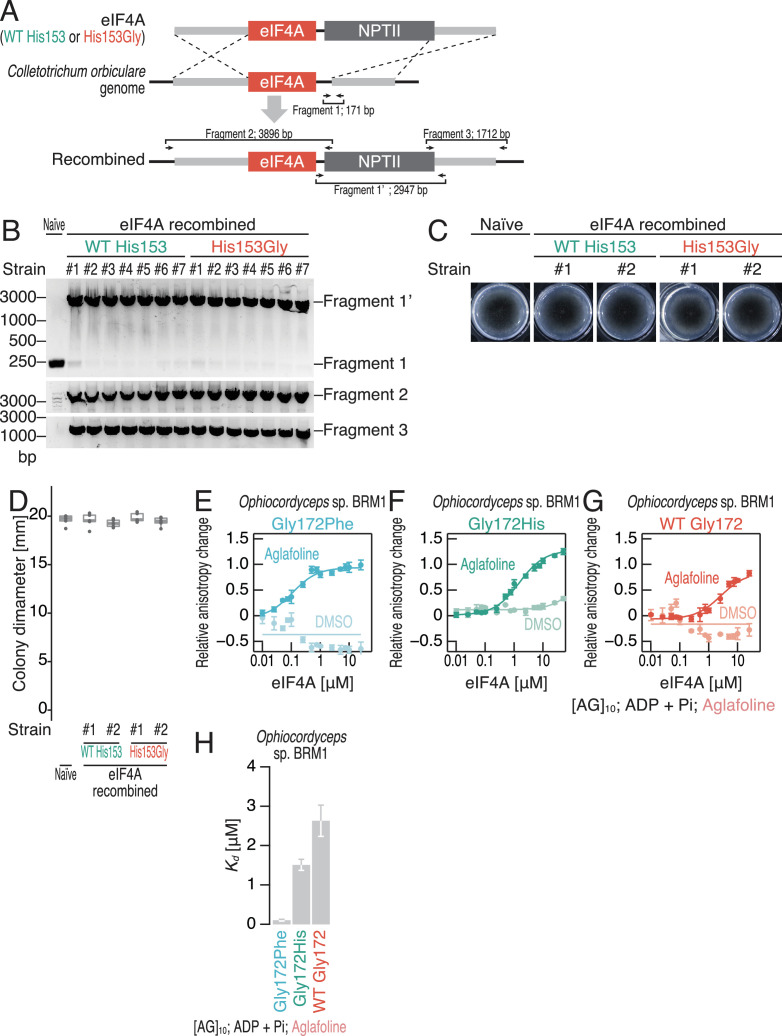
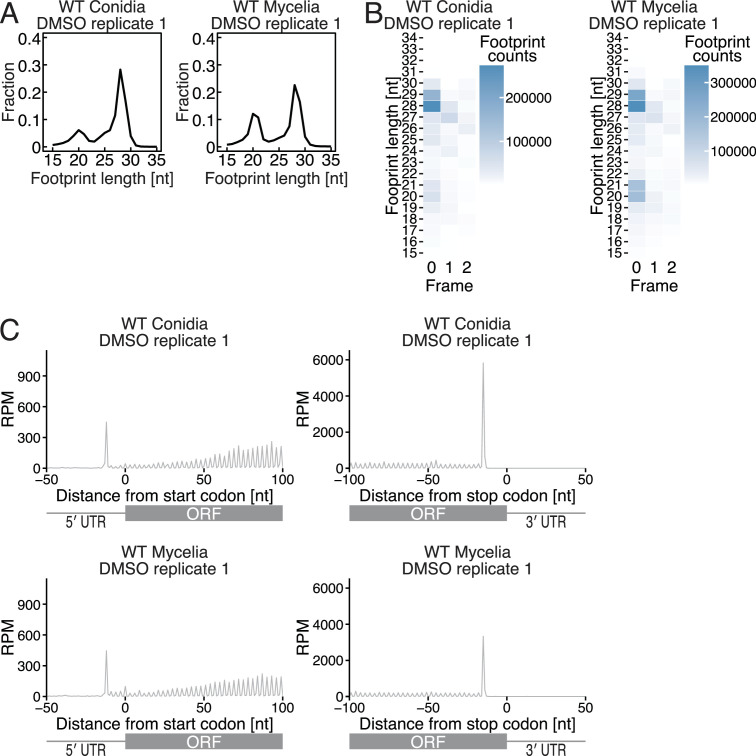
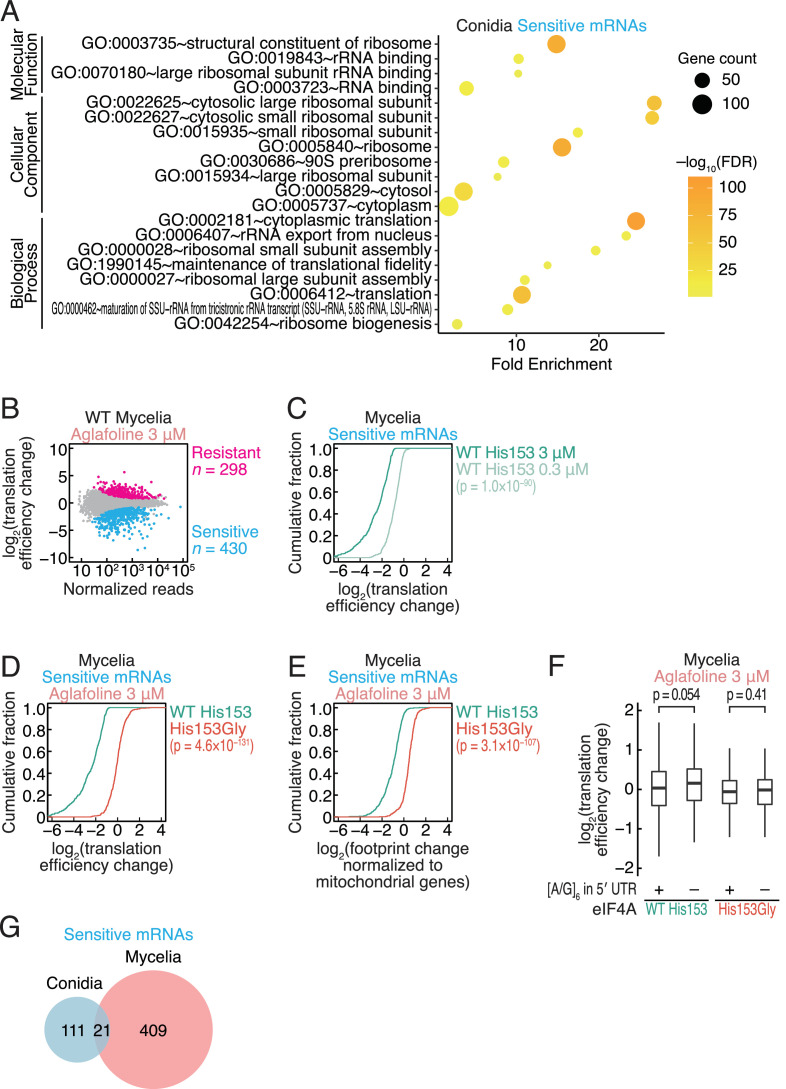
Figure 3. The amino acid substitution in the Ophiocordyceps sp. BRM1 eIF4A confers translational resistance to rocaglates in fungi.
(A) RocA-mediated translational repression recapitulated by an in vitro reconstitution system with human factors. Recombinant proteins of H. sapiens eIF4A1 WT or Phe163Gly were added to the reaction with RocA. Reporter mRNA with CAA repeats or polypurine motifs was translated in the reaction. The data are presented as the mean and s.d. values (n = 3). (B) Translation of complex-preformed mRNAs to test the RocA gain of function. Recombinant proteins of Ophiocordyceps sp. BRM1 eIF4A1 WT or the Gly172His mutant were preincubated with the reporter mRNA possessing polypurine motifs in the presence or absence of RocA. After removal of free RocA by gel filtration, the protein-mRNA complex was added to RRL to monitor protein synthesis. The data are presented as the mean and s.d. values (n = 3). (C) MA (M, log ratio; A, mean average) plot of the translation efficiency changes caused by 3 µM aglafoline treatment in C. orbiculare eIF4AWT conidia. Resistant and sensitive mRNAs (FDR < 0.05) are highlighted. (D) Cumulative distribution of the translation efficiency changes in aglafoline-sensitive mRNAs (defined in C) in C. orbiculare eIF4AWT conidia treated with 0.3 or 3 µM aglafoline. (E) Cumulative distribution of the translation efficiency changes in aglafoline-sensitive mRNAs (defined in C) induced by 3 µM aglafoline treatment in C. orbiculare eIF4AWT and eIF4AHis153Gly conidia. (F) Cumulative distribution of the global translation alterations, which are footprint changes normalized to mitochondrial footprints, in aglafoline-sensitive mRNAs (defined in C) induced by 3 µM aglafoline treatment in C. orbiculare eIF4AWT and eIF4AHis153Gly conidia. (G) Box plot of the translation efficiency changes caused by 3 µM aglafoline treatment in conidia across mRNAs with or without an [A/G]6 motif in the 5′ UTR. The p values in (D–G) were calculated by the Mann–Whitney U test.


