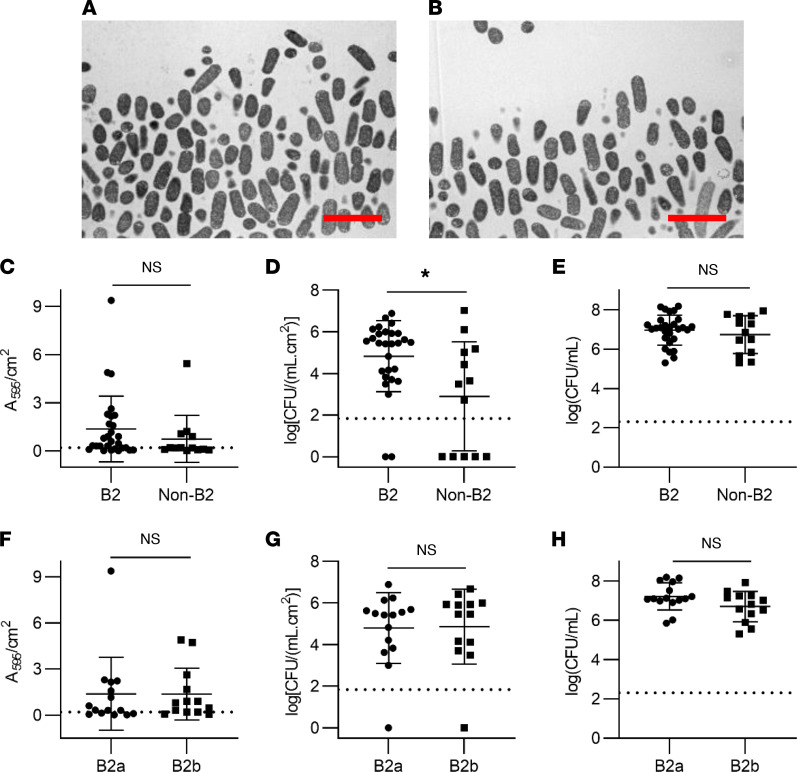
Figure 3. Biofilm formation by CAUTI, CAASB, and rectal isolates.
(A) Transmission electron microscopy (TEM) image of catheter biofilm grown in human urine. Scale bar: 4 μm. (B) TEM image of catheter biofilm grown in artificial urine medium (AUM). Scale bar: 4 μm. (C) Comparison of biofilm biomass (crystal violet retention) between B2 and non-B2 isolates. Mean ± SD plotted for 28 B2 and 13 non-B2 strains. P = 0.22. (D) Comparison of catheter-adherent CFUs between B2 and non-B2 isolates. Mean ± SD plotted for 28 B2 and 13 non-B2 strains. P = 0.02. (E) Comparison of planktonic CFUs in the voided media between B2 and non-B2 isolates. Mean ± SD plotted for 28 B2 and 13 non-B2 strains. P = 0.57. (F) Comparison of biofilm biomass (crystal violet retention) between B2a and B2b isolates. Mean ± SD plotted for 15 B2a and 13 B2b strains. P = 0.62. (G) Comparison of catheter-adherent CFUs between B2a and B2b isolates. Mean ± SD plotted for 15 B2a and 13 B2b strains. P = 0.73. (H) Comparison of planktonic CFUs in the voided media between B2a and B2b isolates. Mean ± SD plotted for 15 B2a and 13 B2b strains. P = 0.13. Statistics were performed with Mann-Whitney U test with P ≤ 0.05 considered as statistically significant. *P ≤ 0.05.

