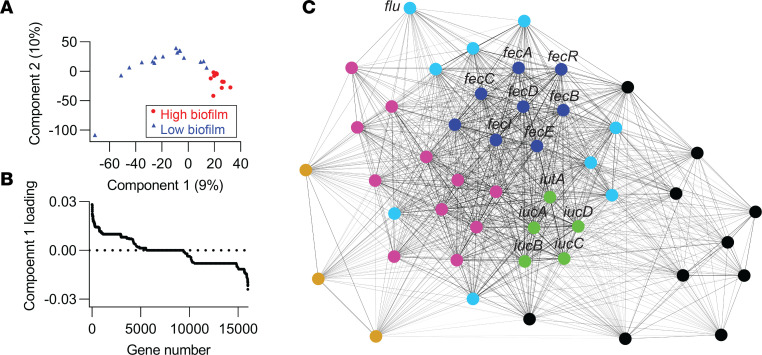
Figure 5. Identification of catheter biofilm–associated genes.
(A) Score plot of the first 2 components from sparse partial least squares discriminant analysis (sPLSDA) for displaying group-wise clustering between high- and low-biofilm formers. (B) Component 1–associated top loadings from sPLSDA identified 72 biofilm-correlated genes, including 46 positive (high-biofilm) and 26 negative (low-biofilm) genes. (C) A force-directed network layout illustrated coassociations and 3 gene communities among 46 biofilm positively associated genes. Each node represented a gene. Each connecting line (edge) represented a positive association between 2 genes that satisfied the significance threshold (5% P value threshold, 1-tailed on the right, Fisher’s exact test). Edge lengths were determined by the level of correlation between connected genes. Nodes were colored by community assignment.

