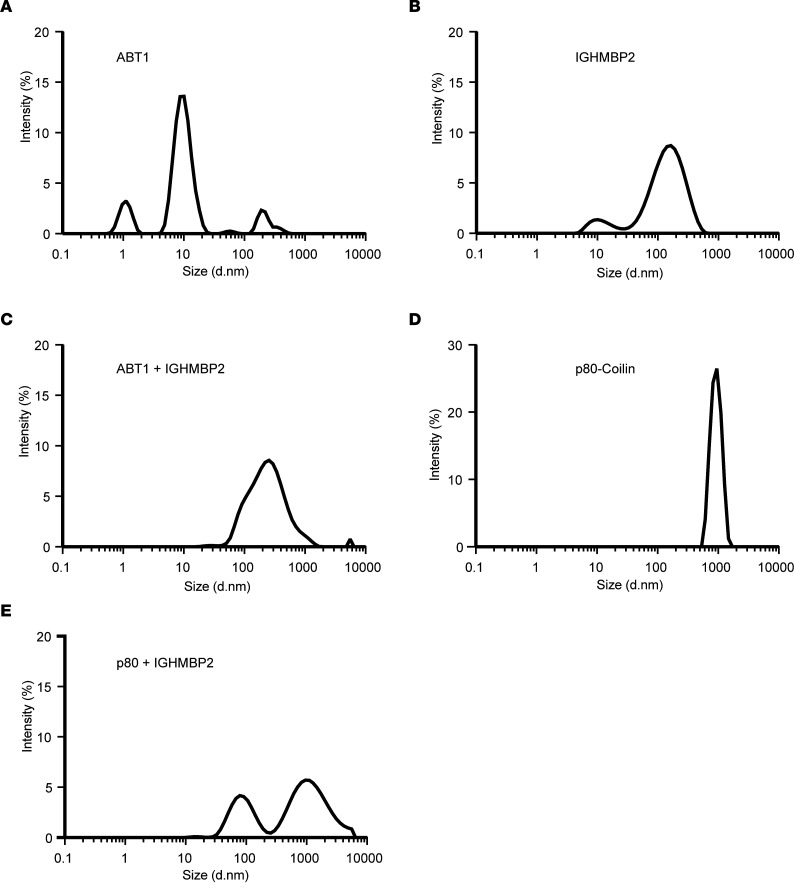
Figure 2. ABT1 associates with IGHMBP2.
(A–D) Graphical representation of DLS physiochemical characteristics by intensity size. (A) Purified ABT1 (mean peak intensity was 13.6 with SD 1.38). (B) Purified IGHMBP2 (mean peak intensity was 8.59 with SD 0.47). (C) ABT1 and IGHMBP2 incubated 1:1 (mean peak intensity was 8.55 with SD 0.47). (D) Purified p80 (mean peak intensity was 26.47 with SD 0.61). (E) p80 and IGHMBP2 incubated 1:1 (mean peak intensity peak 1 was 7.37 with SD 12.76, mean peak intensity peak 2 was 7.96 with SD 7.09) serves as the nonspecific binding control. Each protein was used at 100 nm. Experiments were repeated 3 independent times for 9 measurements.

