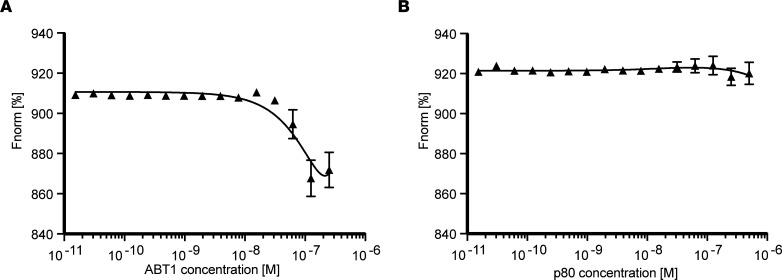
Figure 3. ABT1 binds IGHMBP2 with a high affinity.
Representative binding isotherms generated from microscale thermophoresis (MST) with normalized fluorescence (Fnorm[%]) plotted. IGHMBP2 is RED-Tris-NTA labeled. (A) IGHMBP2 (100 nM) and increasing concentrations of ABT1 (1 μM to 1.53 × 10⁵ μM). The binding affinity was calculated at KD = 52 nM. (B) IGHMBP2 (100 nM) and increasing concentrations of p80 (1 μM to 1.53 × 10⁵ μM) (negative control). The data represent mean values from 3 independent experiments and 9 readings; data are shown as mean ± SD. The data represent mean values from 3 independent experiments and 9 readings; data are shown as mean ± SD. The MST data were analyzed with the MO.Affinity Analysis software and fit to a quadratic equation using nonlinear regression to determine the KD value.

