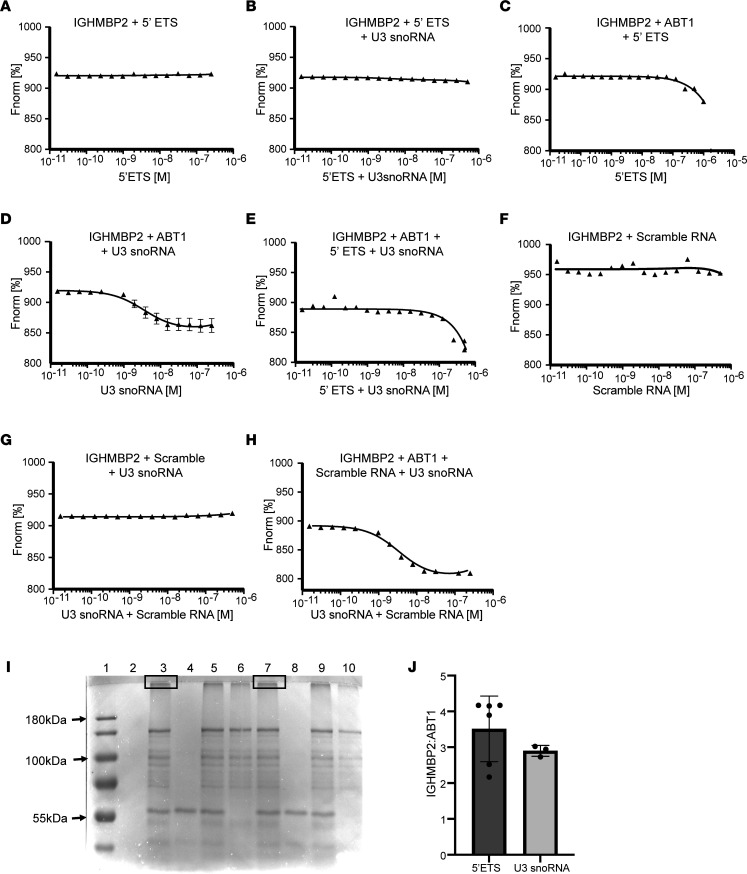
Figure 5. IGHMBP2 and ABT1 associate with the 5′ external transcribed spacer and U3 snoRNA.
Binding isotherms with normalized fluorescence (Fnorm[%]) plotted. IGHMBP2 is RED-Tris-NTA labeled. The 5′ ETS + U3 snoRNA and scramble RNA + U3 snoRNA were annealed. Single RNAs were analyzed with starting concentrations of 1 μM, and 2 RNAs were analyzed with starting concentrations of 500 nM each. (A) 100 nM IGHMBP2 + 5′ ETS RNA. (B) 100 nM IGHMBP2 + 5′ ETS RNA + U3 snoRNA. (C) 100 nM IGHMBP2 + 100 nM ABT1 + 5′ ETS RNA; KD ≥ 697 nM. (D) 100 nM IGHMBP2 + 100 nM ABT1 + U3 snoRNA; KD = 35 nM. (E) 100 nM IGHMBP2 + 100 nM ABT1 + 5′ ETS RNA + U3 snoRNA; KD = 28 nM. (F) 100 nM IGHMBP2 + scramble RNA. (G) 100 nM IGHMBP2 + scrambled RNA + U3 snoRNA. (H) 100 nM IGHMBP2 + 100 nM ABT1 + scramble RNA + U3 snoRNA; KD = 1 nM. Each panel is taken from 9 readings of 3 independent experiments; data are shown as mean ± SD. Values are plotted using MO.Affinity Analysis software, and the data were fit to a quadratic equation using nonlinear regression. The data are fit to a quadratic equation to determine the KD. (I) SDS PAGE gel of UV crosslinked products. Samples were crosslinked for 60 minutes unless stated. Lane 1 shows protein marker; lane 2 shows 5′ ETS RNA; lane 3 shows IGHMBP2, ABT1, 5′ ETS RNA; lane 4 shows ABT1, 5′ ETS RNA; lane 5 shows IGHMBP2, ABT1, 5′ ETS RNA crosslinked 30 minutes; lane 6 shows IGHMBP2, 5′ ETS RNA; lane 7 shows IGHMBP2, ABT1, U3 snoRNA; lane 8 shows ABT1, U3 snoRNA; lane 9 shows IGHMBP2, ABT1, U3 snoRNA crosslinked 30 minutes; and lane 10 shows IGHMBP2, U3 snoRNA. Boxed area in lanes 3 and 7 represent the samples submitted for mass spectrometry. (J) Mass spectrometry IGHMBP2/ABT1 ratio with the 5′ ETS or U3 snoRNA. Three biological samples were normalized to total intensity to quantify IGHMBP2 and ABT1 ± SD.

