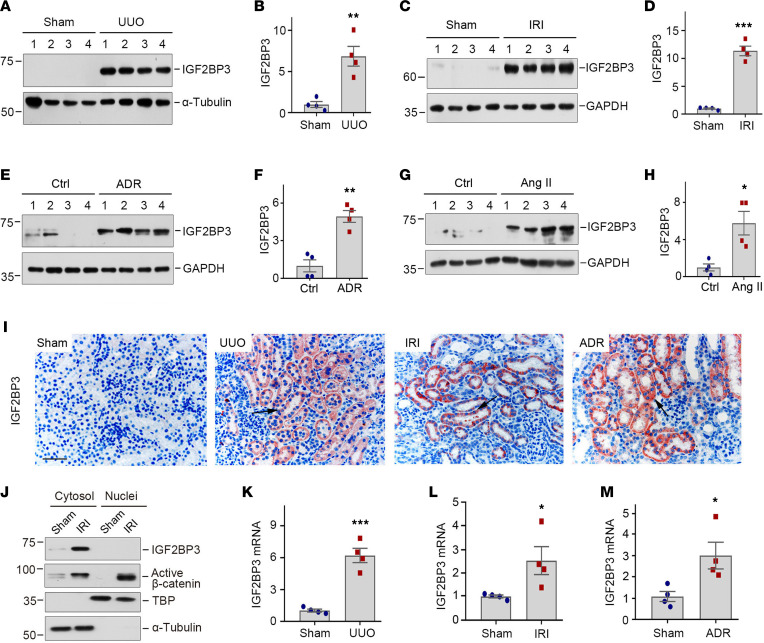
Figure 1. IGF2BP3 is upregulated in renal tubular epithelium in various models of CKD.
(A and B) Western blotting and quantitative determination of IGF2BP3 protein in the kidney at 7 days after UUO. Kidney homogenates after sham and UUO treatment were subjected to Western blotting using anti-IGF2BP3 antibody. **P < 0.01 versus sham (n = 4, t test). (C and D) Western blot analyses of renal expression of IGF2BP3 in IRI. IGF2BP3 expression was assessed in the kidneys at 11 days after IRI. ***P < 0.001 versus sham (n = 4, t test). (E and F) Western blot analyses of renal expression of IGF2BP3 in ADR. IGF2BP3 expression was assessed in the kidneys at 2 weeks after ADR. **P < 0.01 versus sham (n = 4, t test). (G and H) Western blot analyses of renal expression of IGF2BP3 after Ang II infusion. IGF2BP3 expression was assessed in the kidneys at 4 weeks after Ang II infusion. *P < 0.05 versus sham (n = 4, t test). (I) Representative micrographs show renal expression and localization of IGF2BP3 protein in various animal models of CKD. IGF2BP3 was detected by immunohistochemical staining. Arrows indicates positive staining. Scale bar, 50 μm. (J) Western blots showed IGF2BP3 and active β-catenin distribution in cytosolic and nuclear fractions at 11 days after IRI. α-Tubulin and TATA-binding protein (TBP) were used to normalize cytosolic and nuclear fractions. (K–M) qRT-PCR showed renal mRNA levels of IGF2BP3 after UUO (K), IRI (L), and ADR (M), respectively. *P < 0.05, ***P < 0.001 versus sham (n = 4, t test). Numbers to left of blots indicate kDa.

