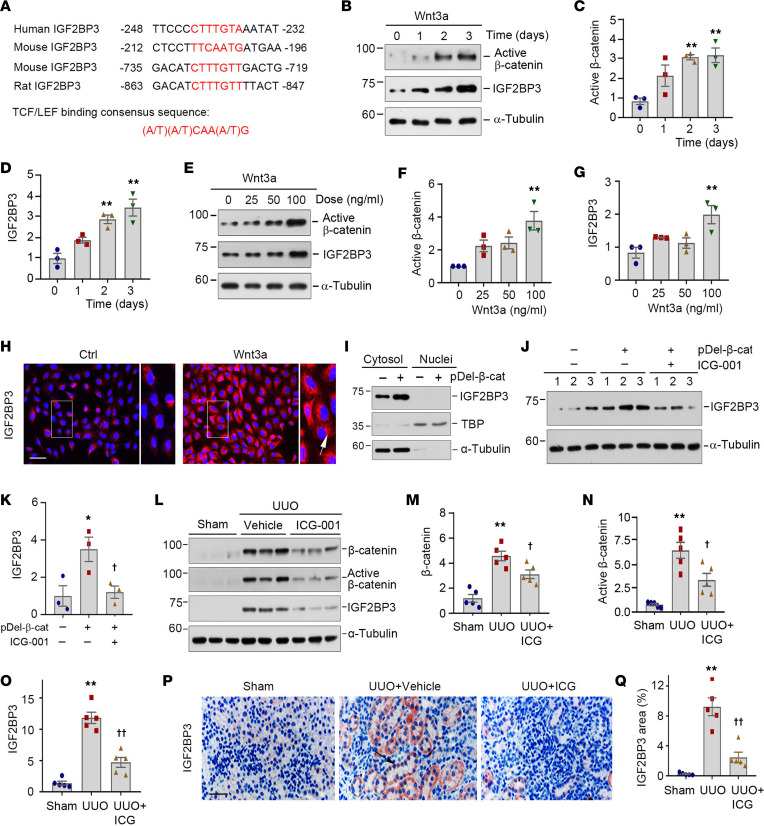
Figure 3. IGF2BP3 is a downstream target of Wnt/β-catenin signaling.
(A) Bioinformatics analyses revealed the presence of putative TBSs in the promoter region of human, mouse, and rat IGF2BP3 gene. The sequences and positions of the putative TBSs were highlighted (red), whereas the TBS consensus sequence was given at the bottom of this panel. TBS, TCF/lymphoid enhancer factor binding site. (B–D) Wnt3a (100 ng/mL) induced active β-catenin and IGF2BP3 expression in HKC-8 cells in a time-dependent manner. Representative Western blot (B) and quantitative data (C and D). **P < 0.01 versus controls (n = 3, ANOVA with Student-Newman-Keuls test). (E–G) Wnt3a induced active β-catenin and IGF2BP3 expression in a dose-dependent fashion. Representative Western blot (E) and quantitative data (F and G). **P < 0.01 versus controls (n = 3, ANOVA with Student-Newman-Keuls test). (H) Immunofluorescence staining for IGF2BP3 expression after Wnt3a stimulation. Cells were stained for IGF2BP3 at 2 days after incubation with Wnt3a. Boxed areas were enlarged. Arrows indicate positive staining. Scale bar, 50 μm. (I) Western blots show IGF2BP3 distribution in cytosolic and nuclear fractions. α-Tubulin and TBP were probed to normalize cytosolic and nuclear fractions. (J and K) Representative Western blot (J) and quantitative data (K) show the expression of IGF2BP3 after various treatments. *P < 0.05 versus controls; †P < 0.05 versus pDel-β-cat group alone (n = 3, ANOVA with Student-Newman-Keuls test). (L–O) ICG-001 reduced renal expression of β-catenin, active β-catenin, and IGF2BP3 protein at 7 days after UUO. Representative Western blots (L) and quantitative data (M–O). **P < 0.01 versus sham; †P < 0.05, ††P < 0.01 versus the UUO injected with vehicle group (n = 5, ANOVA with Student-Newman-Keuls test). (P) Representative micrographs show IGF2BP3 protein in different groups as indicated. Arrows indicate positive staining. Scale bar, 50 μm. (Q) Quantitative determination of IGF2BP3 staining in different groups. **P < 0.01 versus sham; ††P < 0.01 versus the UUO injected with vehicle group (n = 5, ANOVA with Student-Newman-Keuls test).

