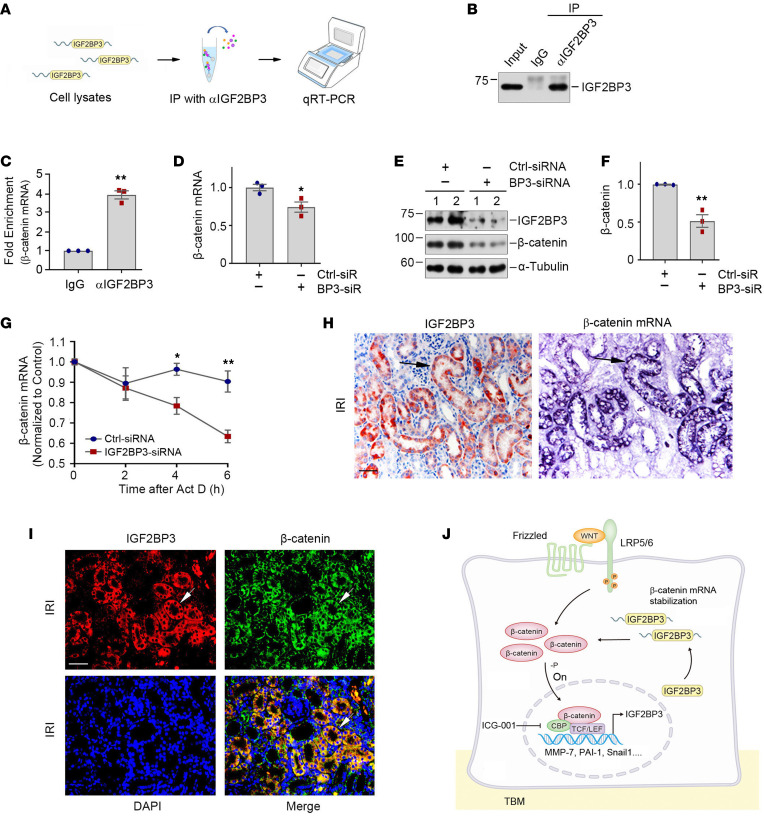
Figure 8. IGF2BP3 binds to β-catenin mRNA and enhances its stability.
(A) Flowchart shows experimental design and procedures. qRT-PCR was performed with the primers of CTNNB1 and 18S rRNA. (B) Representative Western blots show the protein levels of IGF2BP3 from input, RIP with IgG, or αIGF2BP3. (C) Assessment of CTNNB1 mRNA in RIP by qRT-PCR. 18S rRNA was used for normalization. **P < 0.01 versus IgG control group (n = 3, t test). (D) Quantitative data show that knockdown of IGF2BP3 decreases β-catenin mRNA in HKC-8 cells. β-Actin was used for normalization. *P < 0.05 versus Ctrl siRNA group (n = 3, t test). (E and F) Representative Western blots (E) and quantitative data (F) show the expression of β-catenin protein. **P < 0.01 versus Ctrl siRNA group (n = 3, t test). (G) Knockdown of IGF2BP3 decreases β-catenin mRNA stability. *P < 0.05, **P < 0.01 versus Ctrl siRNA group (n = 3, t test). (H) Colocalization of IGF2BP3 protein and β-catenin mRNA in renal tubules after IRI. Kidney serial sections were stained for IGF2BP3 using immunohistochemical staining and β-catenin mRNA using ISH. Arrows indicate IGF2BP3 and β-catenin mRNA colocalization. Scale bar, 50 μm. (I) Colocalization of IGF2BP3 (red) and β-catenin protein (green) in renal tubules after IRI. Arrows indicate IGF2BP3 and β-catenin colocalization. Scale bar, 50 μm. (J) Working model of the reciprocal feed-forward activation loop between IGF2BP3 and β-catenin. In tubular epithelial cells, Wnts’ engagement with their receptors leads to β-catenin activation, resulting in induction of IGF2BP3. In turn, upregulated IGF2BP3 protein activates β-catenin signaling by binding to and stabilizing its mRNA. -P, dephosphorylation; CBP, cAMP response element binding protein binding protein; TBM, tubular basement membrane.

