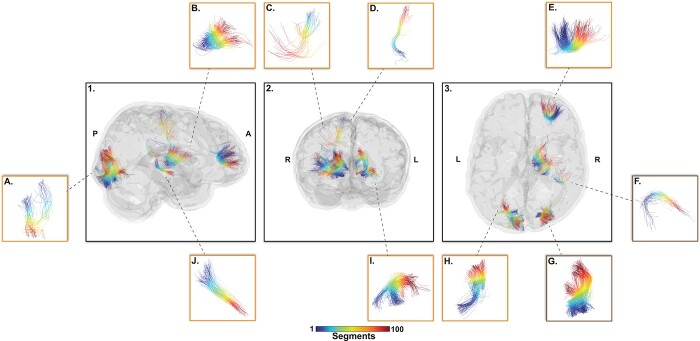
Fig. 3.
Top-10 connections-of-interest that survived the filtering steps from the group comparison analysis (20% higher score vs 20% lower scores). These connections present significant difference on at least 1 DTI metrics (FA, MD, RD, AD) and AFDfixel, AFDtotal, and NuFo as well as being present in every subject from our population. Orange box identifies connections significant for impulsivity and brown box for attention. A) CLG–OPC, B) DC–PFT, C) M6–CD6, D) M6–PPT, E) A46–LA10, F) A41/42–RA40, G) MOG–IOG, H) CCG–MSOG, I) FG37–IOG, J) NA–OT. Color represents connections’ sub-sections.

