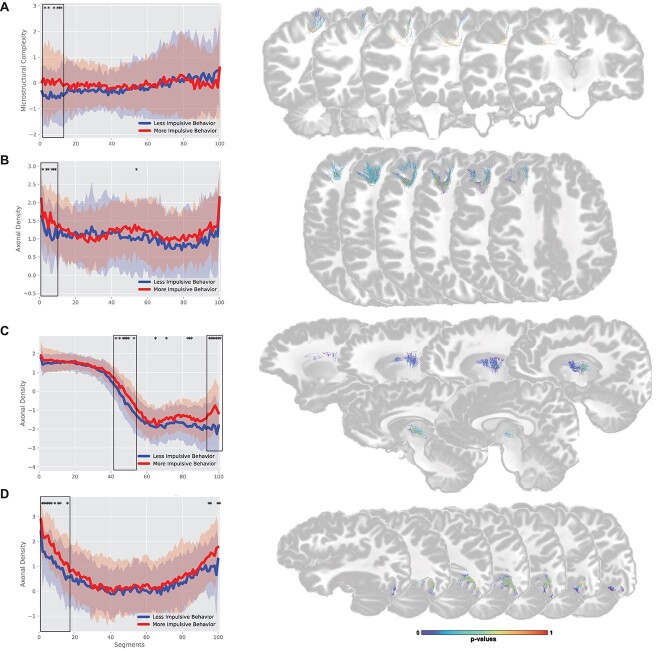
Fig. 5.
Connection profiles comparison between the 20% higher performance and 20% lowest performance group. *: represent sub-sections were both groups are significantly different. Black rectangles represent clusters of significantly different sub-sections (defined as 5 or more closely localize significantly different sub-sections). Analysis was performed using the component extracted from the sub-sections specific metrics (results from tractometry). Axonal density is inverse scored, lower values = higher axonal density while higher values = lower axonal density. A) M6–CD6, B) A46–LA10, C) DC–PFT, D) FG37–IOG. Connection are colored based on P-values for each sub-sections.

