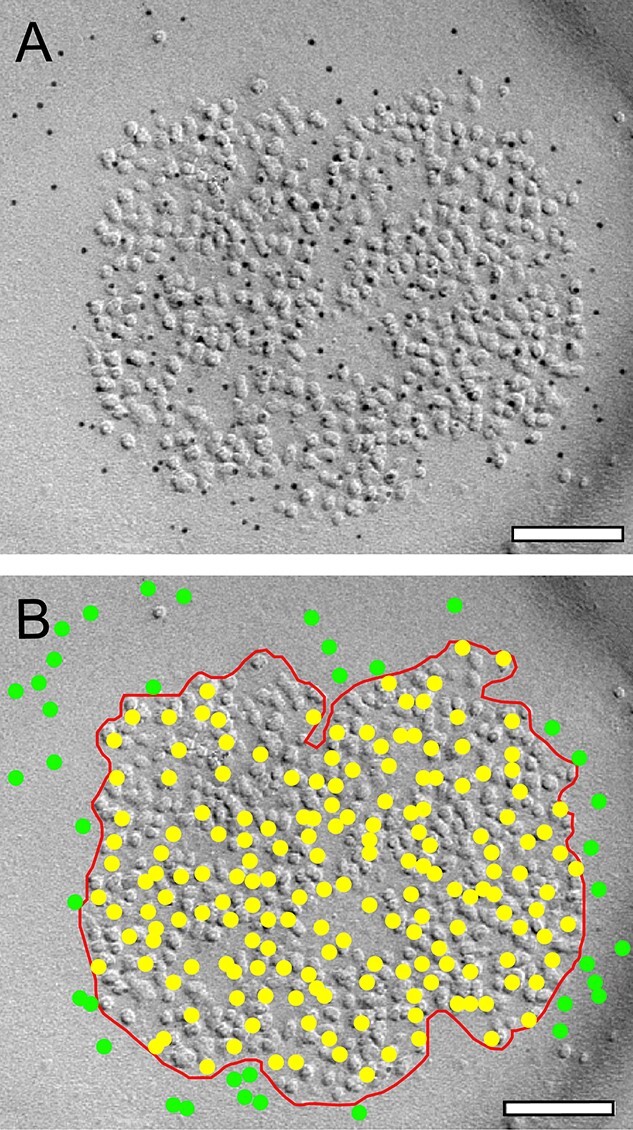
Fig. 1.

Quantitative analysis of the density and distribution pattern of gold particles at individual PSDs. A) High power electron micrograph showing the intrasynaptic distribution of the AMPA receptor at a shaft PSD in L4 of the adult rat “barrel” cortex (indicated by the 5-nm gold particles), visible as a cluster of intramembranous particles on the exoplasmic face of a replica, using SDS-FRIL. B) Same image as in A). Here, a contour line (red) is drawn to outline the PSD to estimate its surface area. Individual gold particles within the PSD contour are highlighted as yellow dots, extra-synaptic gold particles in green that were neglected in the quantitative analysis. Scale bar in A), B 0.1 μm.
