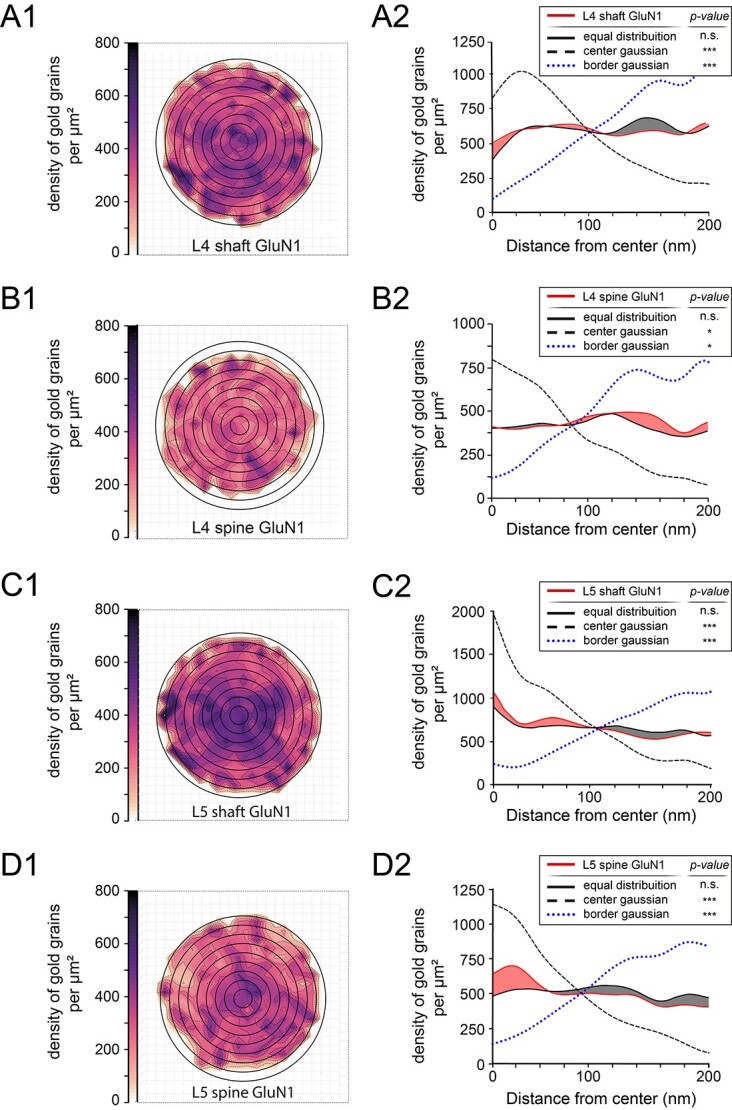
Fig. 10.

GluN1-subunit receptor distribution pattern at L4 and L5 PSDs. A1, A2) Two-dimensional density plot (A1) and 1-dimensional radial distribution-analysis A2) showing the distribution pattern of the GluN1-subunit of the NMDA-receptor at L4 shaft PSDs. B1, B2) Same 2-dimensional density plot B1) and 1-dimensional radial distribution-analysis B2) as illustrated in A1) and A2) for the GluN1-subunit of the NMDA-receptor at L4 spine PSDs. C1, C2) Two-dimensional density plot C1) and 1-dimensional radial distribution-analysis C2) as illustrated in A1 and A2) but for the GluN1-subunit of the NMDA-receptor at L5 shaft PSDs. D1, D2) Two-dimensional density plot D1) and 1-dimensional radial distribution-analysis D2) as illustrated in A1) and A2) showing the spatial distribution for the GluN1-subunit of the NMDA-receptor in L5 spine PSDs.
