Fig. 5.
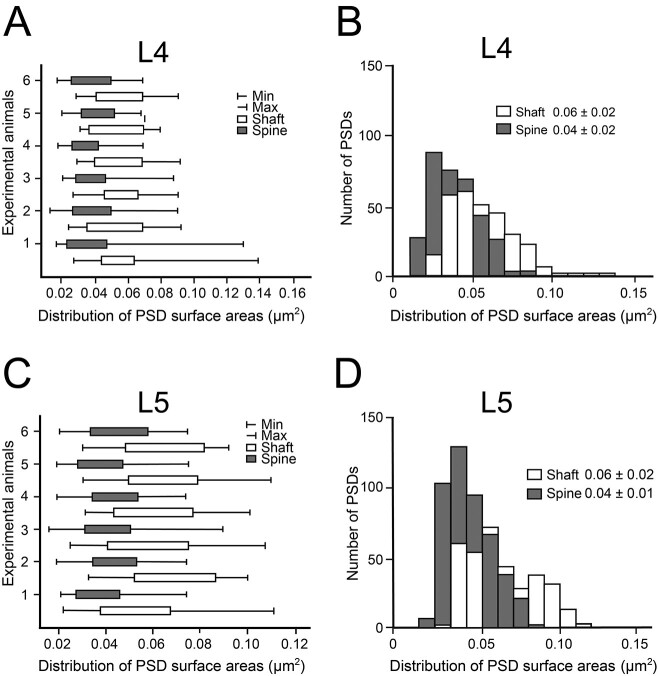
Distribution of PSD surface areas at L4 and L5 synaptic complexes. A, C) Box plots showing the distribution of PSD surface areas between experimental animals for L4 A) and L5 C). Each bar represents the distribution of PSD surface area for the individual experimental animals investigated separated for dendritic shaft (in white) and spine (in gray) PSDs. B, D) Bar histograms showing the distribution of PSD surface areas separated for shaft (in white) and spine (in gray) PSDs at synaptic complexes in L4 B) and L5 D).

