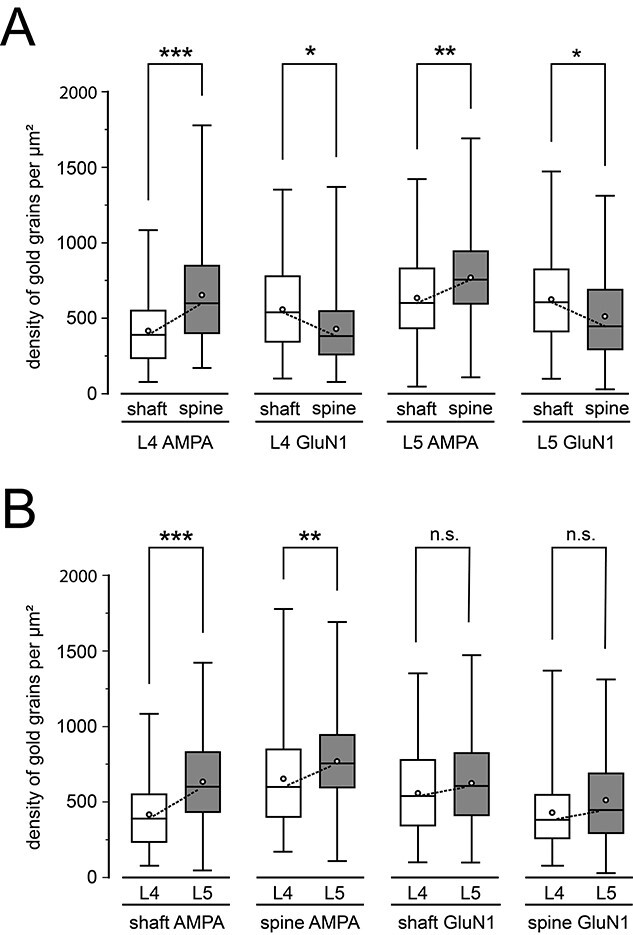
Fig. 6.

Quantitative analysis of the receptor distribution at L4 and L5 synaptic complexes. A) Box plot of receptor densities detected by immuno-labeled gold grains comparing shaft vs. spine PSDs in the same layer and receptor type. B) Box plots of receptor densities but comparing the 2 target layers and receptors in both layers. In all box plots, the length of the box represents the upper and lower quartile, the bar represents the median, the open circles the mean and the lines indicate the minimum and maximum receptor density. Dashed lines indicate the comparison between the corresponding medians. Significant differences were tested with a ranked 2-way ANOVA and post-hoc Fisher’s LSD test. ***P < 0.001; **P < 0.01; and *P < 0.05; n.s.: non-significant.
