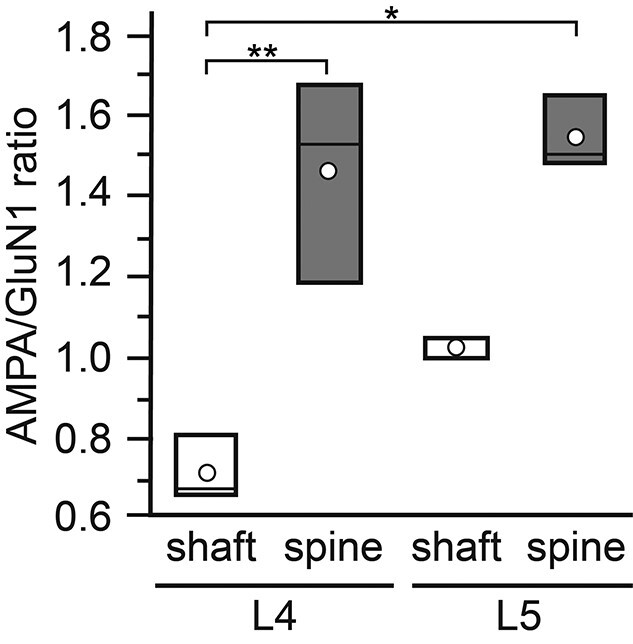
Fig. 8.

Bar histogram showing the AMPA/GluN1 ratio at L4 and L5 PSDs. AMPA/GluN1 ratio in L4 and L5 separated for dendritic shaft (open bars) and spine (gray bars) PSDs. In all bars, the length of the box represents the upper and lower quartile, the line the median, and the open circle the mean. Note that the values for L4 and L5 spine PSDs are quite similar but much higher when compared with those for dendritic shaft PSDs with lowest values for L4 dendritic shaft PSDs. *P < 0.05; **P < 0.01 (Graph Pad Prism H-test with post-hoc Mann–Whitney U-test).
