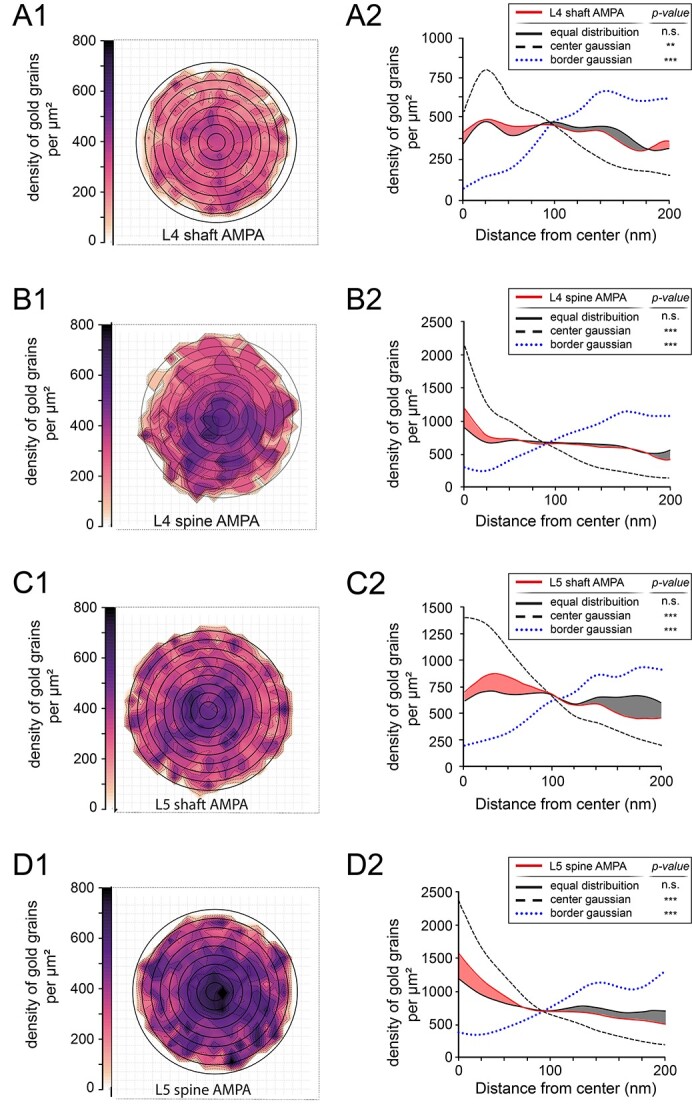
Fig. 9.

AMPA-receptor distribution pattern at L4 and L5 PSDs. A1) Two-dimensional density plot illustrating the spatial distribution of gold grains detecting the AMPA-receptors at L4 dendritic shaft PSDs. Grid in the background indicates the 20 by 20-nm binning of analysis. Note the homogeneous intensity pattern suggesting an equal distribution of receptor labeling detected by gold grains. A2) One-dimensional radial distribution-analysis illustrating the density of gold grains for the actual/measured PSDs (solid red line), a simulated equal distribution (solid black line) at L4 dendritic shaft PSDs. Colored red and gray areas between the red and black solid lines indicate the difference between the actual/measured densities and simulated equal distribution. A simulated Gaussian normal distribution with its peak density at the center (dashed line) and a simulated Gaussian normal distribution with its peak of the PSD or border of the PSD (dotted blue line). B1, B2) Two-dimensional density plot B1) and 1-dimensional radial distribution-analysis B2) as illustrated in A1) and A2) showing the distribution pattern of AMPA receptors at L4 spine PSDs. C1, C2) Two-dimensional density plot C1) and 1-dimensional radial distribution-analysis C2) as illustrated in A1) and A2) but for the distribution pattern of AMPA-receptor at L5 dendritic shaft PSDs. D1, D2) Two-dimensional density plot D1) and 1-dimensional radial distribution-analysis D2) as illustrated in A1) and A2) showing the distribution pattern of AMPA-receptors at L5 spine PSDs.
