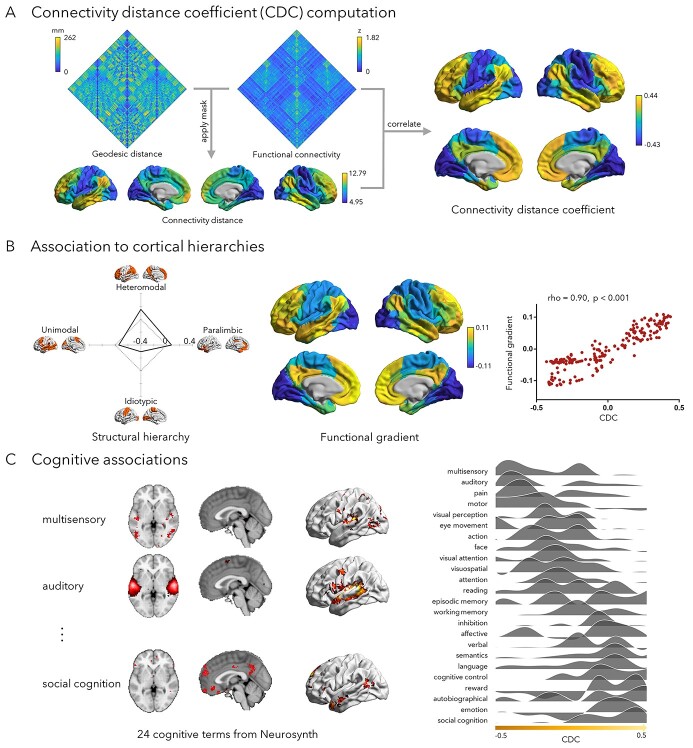
Fig. 1.
Cortex-wide mapping of the connectivity distance coefficient (CDC). A) For each region, we retained its top 10% functional connections. The seed region’s geodesic distance to these regions was averaged resulting in its connectivity distance. For each region, the correlation between its unthresholded functional connectivity and the connectivity distance map was defined as its CDC. B) Stratification relative to an atlas of functional zones (Mesulam 2000; Paquola et al. 2019) and a data driven gradient of rs-fMRI connectivity (Margulies et al. 2016; Vos de Wael et al. 2020). The correlation between CDC and functional gradient was estimated using Spearman’s rank correlation, and P-value was corrected using spin test. C) Cognitive associations based on task-fMRI meta-analysis using Neurosynth (Yarkoni et al. 2011).

