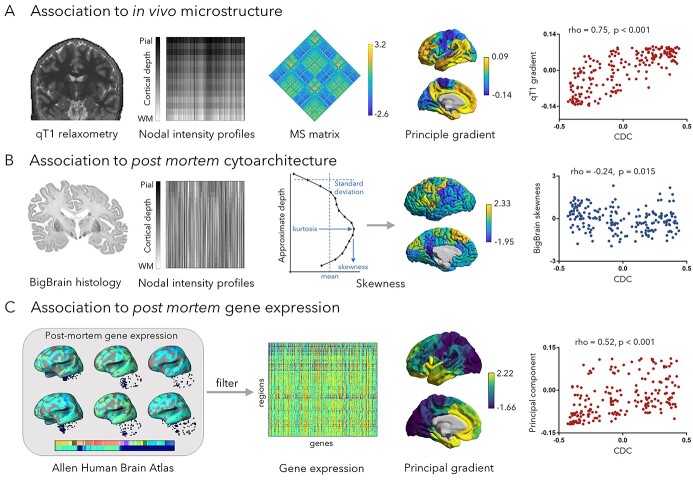
Fig. 2.
Associations to cortical microarchitecture. A) Association to an in vivo microstructural gradient derived from qT1 relaxometry mapping in the same participants. B) Association to post mortem cytoarchitecture measures (intracortical profile skewness) derived from the BigBrain dataset (Amunts et al. 2013). C) Association to post mortem gene expression data derived from the Allen human brain atlas (Hawrylycz et al. 2012). Gene expression data were filtered across six donors, and a CGE matrix was constructed followed by principal component analysis. All correlations between CDC and microarchitectural properties were estimated using Spearman’s rank correlation, and P-values were corrected using spin test. MS, microstructural similarity.

